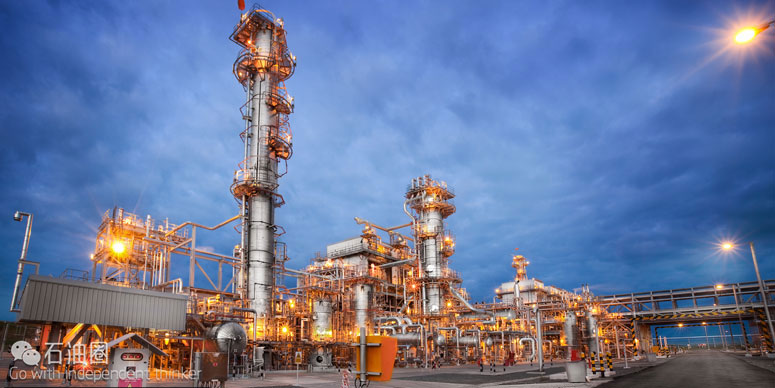
化工产业作为石油行业的下游附属产业之一,在全球能源行列中占据着举足轻重的地位,其中液化烃(HGL)近些年在美国发展迅猛,已经形成了自身成熟的产业链,甚至成为了能够影响美国经济走势的因素之一。本文将从HGL的生产、贸易及投资情况等方面,全面的向大家呈现其相关产业的发展现状。
HGL发展情况日益明朗 原因为何?
液化烃(以下简称HGL)是一种化工品,它可以从未经加工的原油中提炼出来,也可以产自天然气处理厂未经过处理的天然气。2010-2015年,HGL的总产量飙升了42%之多。产量的增长主要归功于天然气处理厂,这使如丙烷一类的轻质烃类气体(以下简称NGPL)产量增加了58%,即从2010年的207万桶/天暴涨至2015年的327万桶/天。然而精炼厂的生产情况则恰恰相反,HGL的产量下降了7%。NGPL产量增长如此迅猛主要是由于天然气开采量的大幅提高所造成的,当然生产者有针对性的开采液含量较多的天然气也是增产的主要原因之一。
1. 价格优势促使NGPL产量突飞猛进
在天然气处理厂中,NGPL从未经处理的天然气流中被提炼出来的同时会产生一些液态物质。分馏厂会把这些液体分离为乙烷、丙烷、正丁烷、异丁烷以及稳定轻烃,当然分离出来的干气,也就是我们常说的残余气体,也会一并走向市场。基于能源结构,历史上NGPL的价格曾与石油产品价格十分接近,甚至常高于天然气的价格。与单独销售未经处理天然气的收益相比,NGPL价格上的优势使分离未经处理的天然气流产生额外的收益。
如图1所示,从NGPL与天然气的相对价格来看,这部分额外收益会产生很大的差异。NGPL的价格不仅与原油价格相关,而且与天然气价格紧密相连。Henry Hub发现,在2002年、2009年以及2014年,天然气的价格平均在4.33美元/百万英热到4.44美元/百万英热之间,而2002年北海布伦特原油的价格为5.63美元/百万英热,也就是32.33美元/桶,2009年为11.81美元/百万英热,即67.82美元/桶,2014年为17.40美元/百万英热,即99.92美元/桶,以上所有价格均以2015年的价格为基准计算。
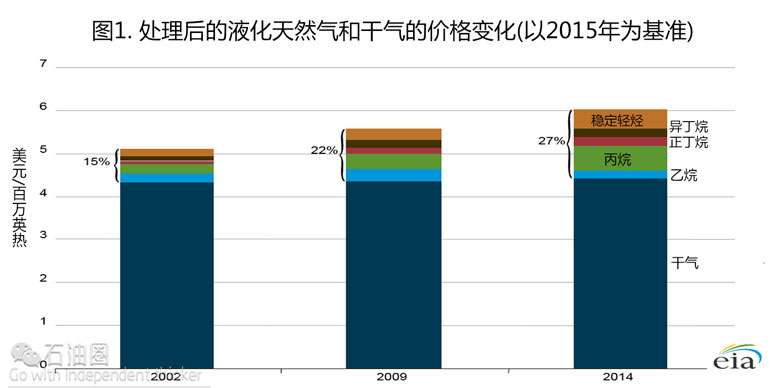
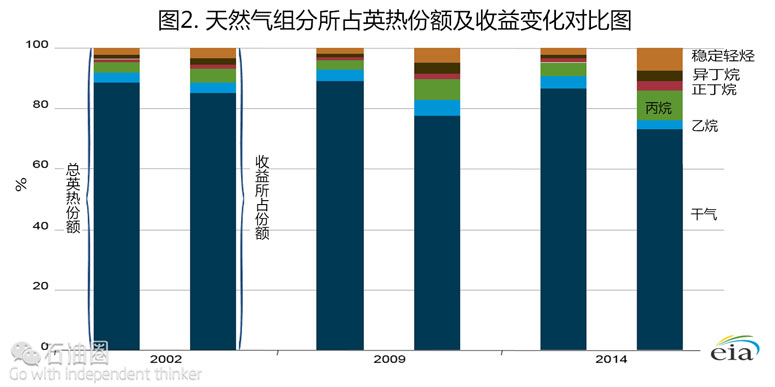
随着行业标准的不断变化以及NGPL与干气的价格差距持续扩大,与干天然气所占的份额相比,NGPL所占的英热份额不断增长,且与干气的收益相比,NGPL及其它液态物质所创造的价值也在飞速提高。尽管NGPL对天然气产生的总英热价值的贡献从2012年的11.6%增至2014年的13.4%,仅有小幅增加,但是它对天然气所产生的总价值的贡献却不容小觑,从2002年的15.1%暴增至2014年的26.7%,总量几乎翻了一倍,如图2所示。
2. 天然气产量增长 助力NGPL持续增产
大量开采致密地层中的天然气和页岩气使得近几年天然气的产量增长迅速。从2010-2015年,美国全国总采集量即总井出流最宽泛的指标,自735亿立方英尺/天增至901亿立方英尺/天,增长了23%。在此期间,美国天然气的主产地也有所改变,美国东北部曾需要大量买进全国其他地区及国外的天然气,而现在却今非昔比,本地区产出的天然气已供大于求。Marcellus区块位于宾夕法尼亚州的西弗吉尼亚及美国阿巴拉契亚北部地区,现已成为全国最多产的天然气生产地。Utica区块与Marcellus区块在地质构造上虽然处于同一区域,但是前者的位置要比后者的开采层次更深一些。Utica区块的出现促进了东北地区的天然气生产,并且也给该地区的生产商带来了更可观的经济效益。
地质与地理方面的转变时刻影响着天然气的生产,油气行业的各部门都应该紧跟形势做出相应调整。生产商要根据新资源的所在地调整人员与设备的部署。中游产业公司要建造能够满足新天然气生产运输容量的管线。而像发电厂和石化产业这样的天然气消费行业,也要投资建造新的工厂和相关的基础设施。
近几年,虽然天然气的产量飙升,但是由于气候变暖所导致的暖冬却降低了消费者对天然气的需求。就Henry Hub天然气交易中心的数据来看,以2015年美元价格计算,天然气价格从2010年1月的6.33美元/百万英热下降到2016年1月的2.23美元/百万英热。因此,尽管天然气产量大幅上升,但美国的天然气价格实际上是有所下降的。不断扩大的天然气与布伦特原油间的价格差是影响NGPL的重要因素,而基于此产生的巨大经济收益则鞭策着生产者去探索和开发能产生更高NGPL份额的天然气资源。2014年末原油价格开始下滑,相较于干气,NGPL的溢价降低,生产商便从开发更高液含量份额的资源转移到开发已有的成熟集输线路的天然气资源上来,因为后者的净生产成本更低。
3. PADD 4成美国NGPL产量大本营
随着油价相较于天然气价格有所增加,我们可以发现,在美国第4石油区即洛基山脉区域(简称PADD4)的活动阐述了天然气开发由干气资源向湿气资源转变的过程。历史上,怀俄明州的天然气产量占了整个PADD 4区域天然气产量的绝大部分。2010年1月,怀俄明州出产了超过70亿立方英尺/天的天然气,大概是整个PADD 4区域56%的产量,而怀俄明州出产的天然气一般是干气。美国地质调查局的报告中指出,产自怀俄明州和蒙大拿州东部的粉盒盆地煤层资源的天然气,仅含有微量(0.005到0.97每百万)的烃类物质,例如丙烷、异丁烷、丁烷、异戊烷及戊烷。而产自怀俄明州西部Jonah油田(见图1)的未经处理的天然气则被认为液态含量更高,其中含有16.4%的烃类物质。而且产出的气体热含量为1212 英热/立方英尺,远远超过由100%甲烷所组成干气的1010英热/立方英尺的热含量。
Niobrara构层主要位于科罗拉多州,产自该区域的未经处理的天然气拥有惊人的1350英热/立方英尺热含量,而且其NGPL含量也高达22.6%。天然气都是从井口的分离器中溢出,干气在通过州际管道运输之前,需要经过进一步处理来去除杂质并且分离出NGPL。在Niobrara构层,人们在油矿分离器中发现大量的原油类液体。由于 Niobrara 构层原油产量比天然气产量高很多,因此Niobrara构层被认为是原油资源地,事实上,这片区域的开采活动也主要以原油和NPGL的经济效益为主,而不是天然气的经济效益。
从2009 年开始,PADD 4 区域生产的重点由怀俄明州转向科罗拉多州,这反映了天然气的生产由干气向湿气资源开始了更广泛的迁移,而发生这种迁移的部分原因是由于2011年到2014年第三季度一直居高不下的油价。在2010年1月,怀俄明州的天然气产量为70亿立方英尺/天, 占据了PADD 4区域56%的产量,在这之后,其产量下跌了19亿立方英尺/天,占PADD 4 总产量的25%,至2016年1月,其产量为50亿立方英尺/天, 占据PADD 4区域总产量46%。截然不同的是,科罗拉多州的天然气产量呈上升趋势,其产量由2010年占PADD 4 区块总产量的33%的42亿立方英尺/天上升到2016年占PADD4区域总产量的42%的46亿立方英尺/天,科罗拉多州与怀俄明州的产量已经十分接近了。
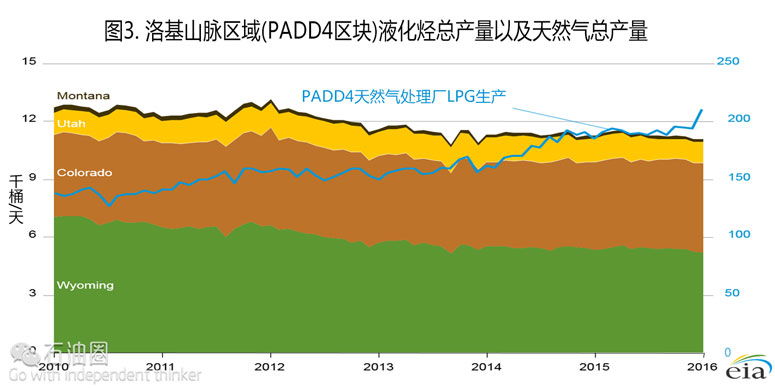
如图3所示,尽管天然气输出有所下降,然而生产商对于富含NGPL的原油资源和天然气资源的关注使得PADD 4 区块的产出液含量持续升高。从2010年1月到2016年1月,PADD 4区块液态丙烷和丁烷的产量上涨了52%,由13.8万桶/天增至21万桶/天。然而,天然气的总采量却下降了13%,从2010年1月的127亿/立方英尺下降到2016年1月的109亿/立方英尺。
如图4所示,在天然气产量停滞不前并且原油产量下滑的时期,PADD 4区块丙烷和丁烷产量的增加反映了美国NGPL产量趋势。在过去一年,即使由于气候潮湿导致开采行为减少,NGPL生产发展的脚步也没有因此而停滞,其发展幅度远远超过了干气生产的发展。
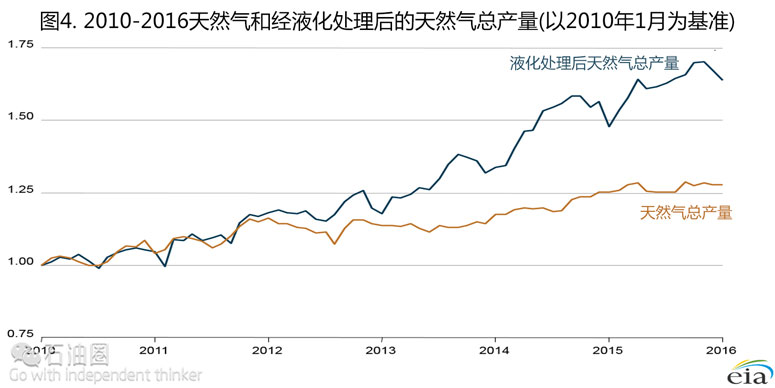
自2010-11年以来,NGPL生产的增长速度超过了国内需求的增长速度。因此导致的市场失衡刺激了更多针对中游和下游生产力的投资去处理、运输、存储、消费和出口不断增产的HGL。例如,在2013年正在运行或者已完成的项目将会使乙烷转变为乙烯的生产能力提高了31%,产量从2900万吨/年增至3800万吨/年。以丙烷生产丙烯(以下简称PDH)能力方面的投资,已经促使PDH的产量提升三倍有余,产量从66万吨/年增至216万吨/年。自2013年以来,美国出口HGL的能力也有了显著的提高。丙烷和丁烷的海外运输能力涨幅超过550%,即从2013年的20万桶/天激增至2017年的132万桶/天。五年前,大家认为通过海路来运输乙烷是不现实的,而现在却完全不一样,运输量从零增长到了28万桶/天。EIA预计,这些项目上的投资大概有330亿美元,并且将会在2018年或是之后开始启动更多的项目。
4. AEO2016预测NGPL产量将持续上升
未来NGPL的生产状况不仅取决于自然资源禀赋,也取决于NGPL所带来经济效益。而NGPL经济效益主要受天然气价格、油价以及基于能源等效基础的两者之间价格差额的影响。如图5所示,2016年度能源展望报告(AEO2016)指出,高低端油气资源和科技项目与油价的起伏都为美国NGPL的发展呈现出不同的发展趋势。鉴于油气生产方面的变化,高低端油气资源及技术项目对NGPL产量有着更加深远的影响。在油价起伏的过程中,NGPL价值是其在未经处理的天然气中含量多少决定的,而NGPL价值也与其生产水平息息相关。
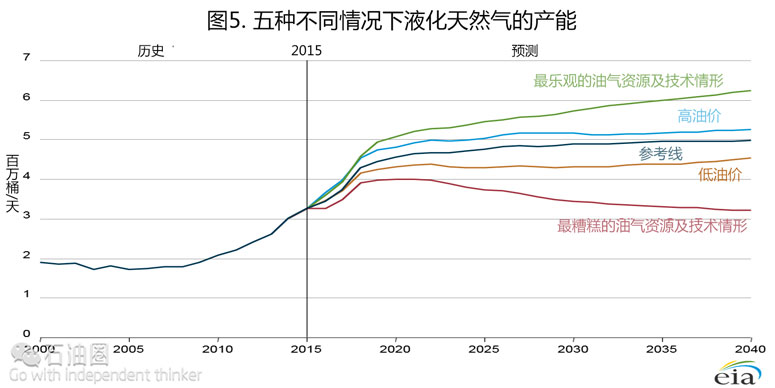
在2010-2014年这段时间内,高溢价使生产项目由天然气生产转移到生产含有更高份额的NGPL上来。随着原油与天然气的相对价格不断地变化,AEO2016显示了NGPL不同的生产增速。直到2014年第四季度油价开始持续下跌之前,天然气通常选择湿气生产而非干气生产。
若要选择这种方式,还需要去做一些权衡,因为与干气可直接在州际管道中的输送不同,湿气在输送到消费者家里之前需要进行一些额外的处理,且在一些区块中,湿气井的生产率往往较低。然而,湿气带来的额外利润能提高天然气生产的经济效益,这就弥补了湿气开采低产能的劣势。因此,由于利益驱使,生产商还是被激励开采更多的湿气井。
如图6所示,在AEO2016的参考实例中,以2015年美元价格计算,2040年布伦特油价将由2016年的平均37美元/桶提高到了136美元/桶;以2015美元/百万英热计算,油气价格比例将会由2016年的2.5增至5.0。2025年,全美国的NGPL产量将由2016年的350万桶/天增至480万桶/天,并且在21世纪30年代末达到500万桶/天。在油价低迷的情形下,NGPL价格在2022年之前都会保持在40美元/桶之下,而后在2040年将增长到73美元/桶。然而,即使2040年天然气产量将由2016年的750亿立方英尺/天增至1150亿立方英尺/天,NGPL产量在2020-2040年间将保持在430万桶/天到450万桶/天之间。在油价涨幅的情况下,天然气产量也会随之略微增长,在2040年达到1270亿立方英尺/天。在2025年,NGPL产量会快速增长至500万桶/天,并在2025-2040年期间维持在520万桶/天。销售NGPL带来的额外利润会使其生产项目辐射到全国的其他区域,而PADD 4区域则会受其影响导致天然气产量下降,因为该区块出产的天然气通常更干一些。而主要出产石油的Bakker区块和位于宾夕法尼亚州西部及西弗吉尼亚狭长区域的Marcellus区块出产的天然气则含有相对较多的液态有机化学物质,因此这些区块的天然气产量将会上升。

石化公司青睐有加 下游行业多维化发展
自2012年NGPL产量增长以来,美国工业便开始激进的提高消费或是出口这些湿气的能力。石油化工原料裂化器能将乙烷、丙烷、常态的丁烷和石脑油转化为乙烯、丙烯和石化产业其他的基础材料。而拥有该设施的运营商宣布,其将扩大设施规模以更好的利用产量不断增加地原料,尤其是NGPL。在2012-2015年美国的第一波项目中,以乙烷为主的额外30万桶/天的原料需求已经通过工厂扩张和重新启用已封存的设备得到了满足。在2016-2018年的第二波项目中,多家石化公司都已宣布将要建造新的乙烯裂化器和丙烯脱氢设施,其中包括陶氏化学公司、雪佛龙菲利普斯化工以及埃克森美孚。这些计划项目将使2018年乙烷原料的需求量增长至50万桶/天,丙烯的需求量则会增加15万桶/天。紧随其后的2019年第三波项目预计,乙烷和丙烷的需求量将会进一步增加37万桶/天。另外,至2015年底,中游产业公司将具备超过97万桶/天的丙烷和丁烷出口能力。在2018年末,预计额外20万桶/天乙烷和丁烷的生产力以及海运20万桶/天的乙烷出口的能力也将成为现实。
在AEO2016高低端油气资源及技术项目和油价参考中显示,用于拓展第一波及第二波石化行业以及出口能力的巨额投资足以保证各相关项目的顺利完成。然而,对于随后上马的一波石化项目以及提高美国HGL出口产能的投资,并不像人们预料的那样会一帆风顺,而是可能会出现不同的结果。
在NGPL生产方面,由于美国天然气价格和国际油价间价格差距悬殊,使得美国本土的生产商在生产NGPL的成本上相对于其他国家更加有自己的优势,而这种巨大差价已经成为刺激美国相关石化工业扩张以及发展HGL出口能力的首要因素。同样的,如果这两者之间的价格差距逐步缩小,那么美国本土生产商的优势就会消失,而出口NGPL的机会也将减少甚至会变得无利可图。然而,出于战略考虑,许多国家正寻求多样化的供应能源,而美国在签署长期合作合同方面可能仍然占有优势。不过这种优势现在已经不那么明显了,因为美国天然气价格与国际油价间的价格差距已经开始减小,众多美国投资者已经宣称,他们将暂缓对石化行业的资金赞助项目、推迟一些项目的完工日期并按一定比例缩小投资范围。
在高油价情况下,美国天然气生产商将更加倾向于开发含液态成分高的气田,这将导致美国市场NGPL供应量飙升。另外在高油价的笼罩下,美国基础化工企业将比其他国家同行拥有更大的成本优势,增加他们在国际市场上的出口机会。在2013-2017年间,预计将会有330亿美元的投资直接投入到不断增多的NGPL原料项目中去。另外,数十亿美元的资本也将投入到相关的上游和下游产业,来带动整个产业。与HGL相关的经济活动已经变成了美国经济的重要组成部分之一。价格将会决定美国石化企业未来的发展走向,美国石化企业是能够进一步助力美国经济发展亦或是半途而废,放缓前进的脚步,就让我们拭目以待吧!
作者/WARREN WILCZEWSKI & BILL BROWN 译者/邢振宇 编辑/徐文凤
Hydrocarbon gas liquids (HGL) are produced at refineries from crude oil and at natural
gas processing plants from unprocessed natural gas. From 2010 to 2015, total HGL
production increased by 42%. Natural gas processing plants accounted for all the
increase, with recovered natural gas plant liquids (NGPL)—light hydrocarbon gases such
as propane—rising by 58%, from 2.07 million barrels per day (b/d) in 2010 to 3.27
million b/d in 2015, while refinery output of HGL declined by 7%. The rapid increase in
NGPL output was the result of rapid growth in natural gas production, as production
shifted to tight gas and shale gas resources, and as producers targeted formations
likely to yield natural gas with high liquids content.
NGPL, contained in the unprocessed natural gas stream, are recovered from natural gas
at gas processing plants, yielding a stream of liquids that is then separated at
fractionation plants into ethane, propane, normal butane, isobutane, and natural
gasoline, as well as dry natural gas (orresidue gas), which is moved to markets. On an
energy content basis, NGPL prices historically have been close to the prices of
petroleum products and are generally well above the price of natural gas. This premium
on the recovered NGPL portion of the unprocessed natural gas stream generates
additional revenue beyond what is achievable from the sale of unprocessed natural gas
at the dry natural gas prices alone.
The additional revenue from NGPL sales can vary significantly, depending on the
relative prices of NGPL and natural gas (Figure IF4-1). NGPL prices are linked to both
crude oil prices and natural gas prices. In 2002, 2009, and 2014, Henry Hub spot
natural gas prices averaged between $4.33 and $4.44 per million British thermal units
(Btu), while North Sea Brent crude oil prices averaged $5.63 per million Btu
($32.33/barrel (b)) in 2002, $11.81 per million Btu ($67.82/b) in 2009, and $17.40 per
million Btu ($99.92/b) in 2014 (all prices in 2015 dollars).
Changes in industry practice, combined with the increasing premium generated by the
NGPL component of the unprocessed natural gas stream relative to dry natural gas,
resulted in both an increasing share of Btu coming from NGPL, relative to dry natural
gas, and rapid growth in the value generated by those liquids, relative to the dry
natural gas component of the unprocessed natural gas. Consequently, although the NGPL
contribution to the total Btu value of natural gas produced increased only marginally,
from 11.6% in 2002 to 13.4% in 2014, its contribution to the total value of natural gas
produced nearly doubled, from 15.1% in 2002 to 26.7% in 2014 (Figure IF4-2).
Natural gas production from tight and shale gas formations has grown rapidly in recent
years. From 2010 to 2015, total U.S. gross withdrawals, the broadest measure of total
wellhead flows, increased by 23%, from 73.5 billion cubic feet per day (Bcf/d) to 90.1
Bcf/d. The geography of natural gas production has also changed over this period, with
the northeastern United States (previously a net recipient of large amounts of natural
gas from the rest of the country and abroad) now producing more natural gas than it
uses. The Marcellus Formation, which underlies much of West Virginia, Pennsylvania, and
other states in the northern Appalachian region, has become the most prolific natural
gas-producing formation in the country. The presence of the Utica Formation, which
overlaps but is deeper than the Marcellus Formation, bolsters production in the
Northeast and improves the economics for producers, adding to their return on
investment.
Changes accompanying the rapid shift of natural gas production, both geographically and
geologically, have required all segments of the oil and gas industry to adapt:
producers have moved personnel and equipment to the locations of the new resources;
midstream companies have started building additional natural gas processing and
pipeline capacity; and consuming industries such as power producers and petrochemicals
have invested in new plants and related infrastructure.
The recent surge in natural gas production, together with several mild winters that
lower natural gas demand, resulted in a decline in U.S. natural gas prices (as reported
at the Henry Hub natural gas trading hub) from $6.33/million Btu in January 2010 to
$2.23/million Btu in January 2016 (2015 dollars). The increasing spread between spot
natural gas prices and Brent crude oil prices, on which NGPL prices are largely based,
spurred producers to explore for and develop natural gas resources that yield a higher
share of NGPL. When crude oil prices started falling in late 2014, the premium
commanded by NGPL over dry natural gas diminished, and producers began to shift
activity out of areas with high liquids yield to resources yielding higher quantities
of pipeline-ready natural gas at the lowest net production cost.
Activity in the Rocky Mountains region (Petroleum Administration for Defense District 4
[PADD 4]) illustrates the shift from development of dry natural gas resources to wet
natural gas resources as the ratio of crude oil prices to natural gas prices increases.
Historically, Wyoming has accounted for most of the natural gas production in PADD 4.
In January 2010, more than 7 Bcfd of natural gas was produced in Wyoming, accounting
for 56% of the PADD 4 total. Natural gas produced in Wyoming is generally considered
dry. The U.S. Geological Survey has reported that natural gas produced from coalbed
resources in the Powder River Basin, which underlies eastern Wyoming and Montana,
contains “trace amounts (0.005 to 0.97 parts per million) of [other] hydrocarbons (for
example, propane, isobutane, butane, isopentane, and pentane)”. Composition of the
unprocessed natural gas produced from the considerably wetter Jonah field in western
Wyoming (Table IF4-1) includes 16.4% hydrocarbons, and the gas produced has a heat
content of 1,215 Btu per standard cubic foot (Btu/scf)—well above the heat content of
1,010 Btu/scf for dry natural gas consisting of 100% methane.
Unprocessed natural gas produced from the Niobrara Formation [2], located
predominantly in Colorado, has an even higher heat content of 1,350 Btu/scf and an NGPL
content of 22.6%. The natural gas comes out of a lease separator at the wellhead and
requires further processing to remove impurities and to separate out the NGPL before
the dry natural gas is suitable for transport via interstate pipelines. In the Niobrara
Formation, significant quantities of liquids, classified as crude oil, also are
recovered at the lease separator. Because of the high ratio of crude oil to natural gas
volumes produced from the Niobrara Formation, it is considered a crude oil resource,
and activity in the field is determined more by the economics of crude oil and NGPL
than by the economics of natural gas.
The shift of production in PADD 4 from Wyoming to Colorado since 2009 reflects a
broader shift of natural gas production from dry to wet resources, in part because of
consistently high crude oil prices from 2011 through the third quarter of 2014. After
reaching more than 7 Bcf/d in January 2010 (56% of PADD 4 production), natural gas
production in Wyoming declined by 1.9 Bcf/d (25% of PADD 4 production) to 5.0 Bcf/d in
January 2016 (46% of PADD 4 production). Natural gas production in Colorado increased
from 4.2 Bcf/d in 2010 (33% of PADD 4 production) to 4.6 Bcf/d in January 2016 (42% of
PADD 4 natural gas production), approaching the production levels in Wyoming.
The focus of producers on crude oil resources and natural gas that is rich in NGPL has
led to more production of liquids in PADD 4, even as natural gas output has declined
(Figure IF4-3). From January 2010 to January 2016, PADD 4 production of propane and
butanes increased by 52%, from 138 thousand b/d to 210 thousand b/d [3], while gross
withdrawals of natural gas declined by 13%, from 12.7 Bcf/d in January 2010 to 10.9
Bcf/d in January 2016.
The increase in PADD 4 propane and butanes production, at a time when natural gas
production growth is stagnant or falling and when crude oil production is declining,
mirrors trends in NGPL production nationwide. Even the reduction of activity in the
wettest areas over the past year or so has not slowed the growth of NGPL production,
which has exceeded the growth of dry natural gas production (Figure IF4-4).
The growth of NGPL output since 2010–11 has outpaced the growth of domestic demand.
The resulting market imbalance has spurred investment in midstream and downstream
capacity to process, transport, store, consume, and export increasing quantities of
HGL. For example, projects either completed since 2013 or currently under construction
will increase the capacity to produce ethylene from ethane by 31%—from 29 million
metric tons (mmt)/year to 38 million mmt/year. Investments made in propane
dehydrogenation (PDH) capacity, which converts propane to propylene) [4], have
increased total PDH capacity more than threefold—from 0.66 mmt/year to 2.16 mmt/year.
U.S. capacity to export HGL also has undergone significant expansion since 2013.
Capacity to ship propane and butane overseas has grown by more than 550%—from 0.2
million b/d in 2013 to 1.32 million b/d in 2017, and capacity for marine exports of
ethane, which only five years ago were not considered viable, have increased from zero
to 0.28 million b/d [5]. EIA estimates total investment in these projects at
approximately $33 billion, and more projects have been proposed with completion dates
in 2018 and beyond [6].
NGPL PRODUCTION IN AEO2016
The future production profile for NGPL will be determined to a large extent not only by
the natural resources endowment but also by production economics, which are influenced
primarily by natural gas and crude oil prices and the spread between their prices on an
energy-equivalent basis. In theAnnual Energy Outlook 2016 (AEO2016), the High Oil and
Gas Resource and Technology case and the Low Oil and Gas Resource and Technology case,
as well as the High Oil Price case and the Low Oil Price case (Figure IF4-5), reflect
different possible futures for U.S. NGPL production. The High and Low Oil and Gas
Resource and Technology cases have a more significant effect on NGPL output because of
changes in natural gas and crude oil production. In the High and Low Oil Price cases,
production levels are influenced by the changes in value resulting from increases or
decreases in the amount of NGPL contained in the unprocessed natural gas.
As in the 2010–14 period, when a high premium for liquids led to a shift in natural
gas production to those areas where natural gas yielded higher shares of NGPL relative
to dry natural gas, the AEO2016 results suggest varying rates of NGPL production
growth, depending on relative crude oil and natural gas prices. Until crude oil prices
began their sustained decline in the fourth quarter of 2014, natural gas producers
generally had chosen wet gas production over dry natural gas production. That choice
required some tradeoffs: wet gas needs to be processed before it can be injected into
interstate natural gas pipelines for delivery as dry natural gas to consumers, and
wells drilled in formations that yield wet natural gas generally have lower initial
production rates. However, the extra revenue generated by the liquids can improve the
economics of natural gas production and create an incentive to focus drilling on wet
natural gas resources.
In the AEO2016 Reference case, with Brent crude oil prices rising from an average of
$37/b in 2016 to $136/b in 2040 (2015 dollars), the oil-to-gas price ratio (2015
dollars/million Btu) increases from 2.5 in 2016 to 5.0 in 2040 (Figure IF4-6). Total
U.S. NGPL production increases from 3.5 million b/d in 2016 to 4.8 million b/d in 2025
and to almost 5 million b/d in the late 2030s. In the Low Oil Price case, with oil
prices remaining below $40/b until 2022 and then increasing to $73/b in 2040, NGPL
production averages between 4.3 million b/d and 4.5 million b/d from 2020 to 2040, even
as natural gas production grows from 75 Bcf/d in 2016 to 115 Bcf/d in 2040. In the High
Oil Price case, natural gas production increases at a slightly higher rate, to 127
Bcf/d in 2040, and NGPL production increases rapidly to 5.0 million b/d in 2025 and
then levels off at about 5.2 million b/d from 2025–40. The additional revenue from
NGPL sales also shifts production to other regions of the country, resulting in a
decrease in PADD 4 natural gas output, where unprocessed natural gas is generally
drier, and an increase in production from the Bakken Formation (primarily associated
with oil production) and parts of the Marcellus Formation, centered around western
Pennsylvania and the West Virginia panhandle, where the unprocessed natural gas has a
relatively high liquids content.
Since 2012, when NGPL production started to increase, the U.S. industry has responded
with an aggressive build-out of capacity to consume or export the liquids. Operators of
petrochemical crackers (plants designed to convert ethane, propane, and normal butane,
as well as naphtha, to ethylene, propylene, and other building blocks of the
petrochemical industry) announced plans to expand their facilities to take advantage of
the rising availability of feedstock, particularly NGPL. In the first wave of projects
in the United States from 2012 to 2015, an additional 300,000 b/d of feedstock demand,
primarily for ethane, was developed through plant expansions and restarts of mothballed
facilities. In the second wave from 2016 to 2018, large established petrochemical
companies, including Dow Chemical, Chevron Phillips Chemical, and ExxonMobil, have
announced plans for new large-scale ethylene crackers and propane dehydrogenation
facilities that would increase demand for ethane feedstock by up to 0.5 million b/d and
for propane feedstock by an additional 0.15 million b/d by 2018. In the third wave from
2019 onwards, a further 0.37 million b/d expansion of ethane and propane feedstock
demand has been proposed. In addition, midstream companies brought more than 0.97
million b/d of propane and butane export capacity into service by the end of 2015, with
another 0.2 million b/d of propane and butane capacity and nearly 0.2 million b/d of
marine ethane export capacity slated to come online by the end of 2018.
In the AEO2016 Oil and Gas Resource and Technology cases and Oil Price cases, the
significant commitment of capital to projects in the first and second waves of
petrochemical industry expansion, as well as most of the export capacity expansion,
results in completion of the projects. However, later waves of petrochemical projects,
as well as any further expansion of U.S. HGL export capacity, have different outcomes
across those cases.
The primary motivation for the buildout of U.S. industrial and export HGL capacity is
the impact of the wide price spread between U.S. natural gas prices and international
crude oil prices on NGPL production, which creates a price advantage for U.S. producers
relative to producers in other countries. As such, any narrowing of the price spread
would reduce the competitive advantage and reduce opportunities for exports of U.S.
NGPL to international destinations, possibly to the point of making exports of spot
cargoes unprofitable. However, for many countries seeking to diversify sources of
supply for strategic reasons, the United States may still have an advantage in long-
term contracts. The price spread has narrowed recently, and sponsors of major
petrochemical projects in the United States have announced postponements of some
investment decisions, pushed back completion dates, and scaled down the scopes of some
projects.
In the High Oil Price case, U.S. natural gas producers are projected to target
formations with the highest liquids content, resulting in greater supply of NGPL to the
U.S. market. In addition, the High Oil Price case provides U.S.-based petrochemical
plants with a cost advantage relative to their international peers, resulting in better
opportunities for U.S. exporters in international markets. With an estimated $33
billion in projects between 2013 and 2017 directly tied to the growing availability of
HGL feedstock, and billions more in associated upstream and downstream activities,
HGL-related economic activity has become a major factor in the U.S. economy. Depending
on future prices, developments in the U.S. petrochemical industry may provide either
further growth in this segment of the U.S. economy or a slowdown from recent high
activity levels.
未经允许,不得转载本站任何文章:
-

- 阿佳徐
-
石油圈认证作者
- 毕业于黑龙江大学英语口译专业,具有丰富的翻译工作经验。致力于观察国际油气行业动态,能够快速、准确传递油气行业最新资讯,提供丰富的油气信息,把握行业动向,为国内企业提供专业的资讯服务。(QQ:348418756)


 石油圈
石油圈


