Global oil supplies rose by 0.6 mb/d in June to 96 mb/d after outages curbed OPEC and non-OPEC supplies in May. World production was 750 kb/d below last year as higher OPEC output only partially offset non-OPEC declines. Non-OPEC supplies are set to drop by 0.9 mb/d in 2016, to 56.5 mb/d, before rising 0.2 mb/d in 2017.
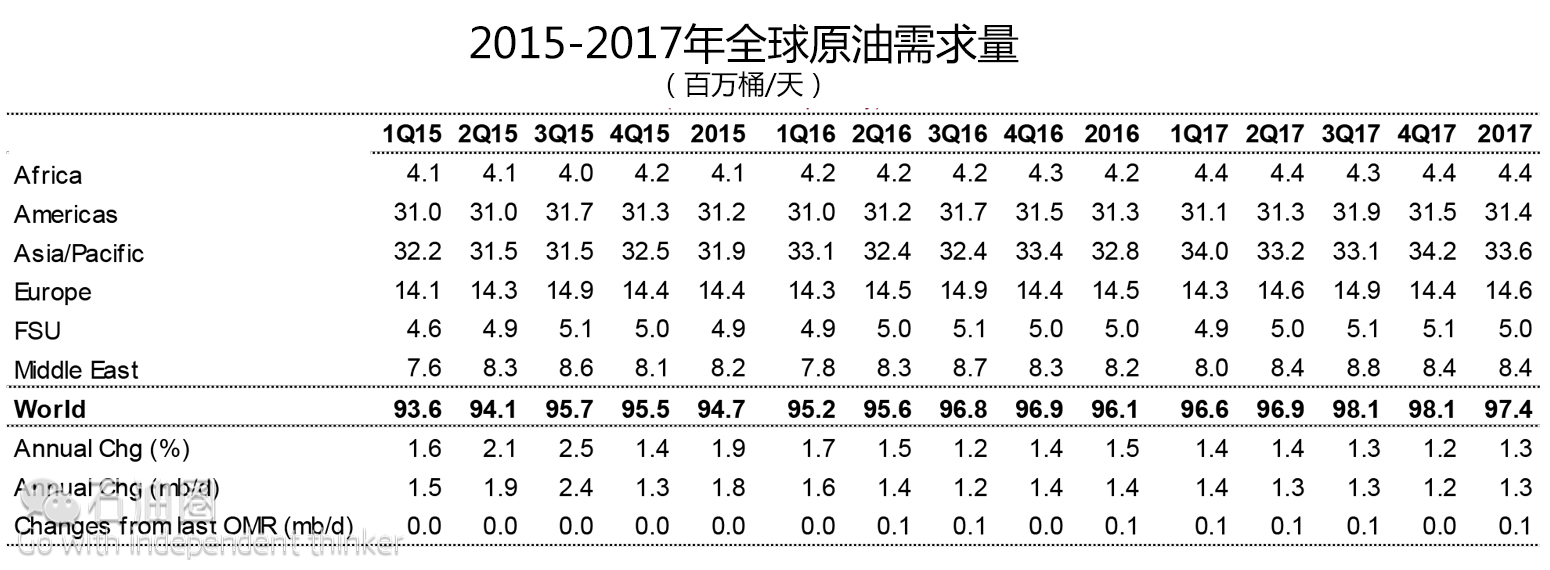
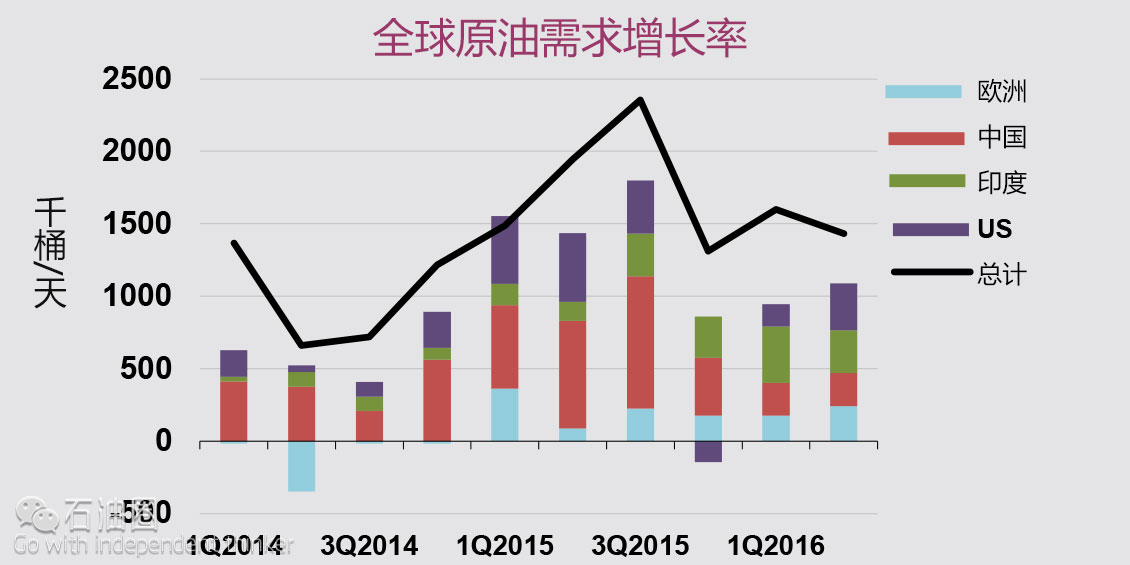
Robust European demand supported 2Q16 global demand growth at around 1.4 mb/d y-o-y, momentum that will be roughly matched through the year as a whole. A modest deceleration is foreseen in 2017, as growth eases to 1.3 mb/d taking average deliveries up to 97.4 mb/d.
Crude oil prices eased from an early June peak above $52/bbl, and traded within a $45-$50/bbl range. Growing uncertainty over the global economy and a stronger dollar weighed, but the downside was limited by further declines in US production and inventories.
OPEC crude output rose by 400 kb/d in June to an eight-year high of 33.21 mb/d, including newly re-joined Gabon. Saudi Arabia ramped up to a near-record rate of 10.45 mb/d and Nigerian flows partially recovered from rebel attacks. Middle East producers sustained record levels, building market share and pushing OPEC’s total output 510 kb/d above a year ago.
OECD commercial inventories built by 13.5 mb in May to end the month at a record 3 074 mb. Preliminary information for June suggests that OECD stocks added a further 0.9 mb while floating storage has continued to build, reaching its highest level since 2009.
May global refinery throughput plunged by almost 1 mb/d from April and stood 1.5 mb/d lower year-on-year, as heavy outages took a toll in many regions. This lowered the 2Q16 estimate for global refinery intake, to 78.5 mb/d – the first y-o-y drop in three years. Our forecast for 3Q16 throughput is more steady at 80.95 mb/d.
BALANCING ACT – COULD IT TIP OVER?
After the drama we saw at the beginning of this year when prices were sliding daily, the fact that crude oil has in the past two months moved within a range in the high $40s/bbl should be a relief for some producers. For some time now this Report has signalled a return to balance as being the big picture direction in which the market is heading. The adjustments to our data this month suggest that little has changed with the market showing an extraordinary transformation from a major surplus in 1Q16 to near-balance in 2Q16.
In mid-summer 2016, although market balance is upon us, the existence of very high oil stocks is a threat to the recent stability of oil prices: in 1Q16 refinery runs growth was 60% higher than refined product demand growth. Despite the regular upwards revisions to demand that we have seen in recent Reports there are signs that momentum is easing; and, although stocks are close to topping out, they are at such elevated levels, especially for products for which demand growth is slackening, that they remain a major dampener on oil prices. With global refinery runs expected to fall by 0.8 mb/d in 2Q16 before surging by 2.4 mb/d in 3Q16, we may well see crude oil stocks fall back but there is a risk that, unless demand turns out to be stronger than we currently anticipate, products stocks could rise still further and threaten the whole price structure.
In China, for example, data for May suggests that year-on-year demand growth was only 130 kb/d, part of a recent trend of smaller increases. For the United States, estimated gasoline deliveries in April were up just 75 kb/d up on the year earlier and 410 kb/d below our expectations. Somewhat unexpectedly, the saving grace for oil demand has been Europe where, in 2Q16 y-o-y growth reached a five-quarter high. This is unlikely to last, though, with the ongoing precariousness of the European economies now dealing with added uncertainty following the result of the UK referendum on membership of the European Union.
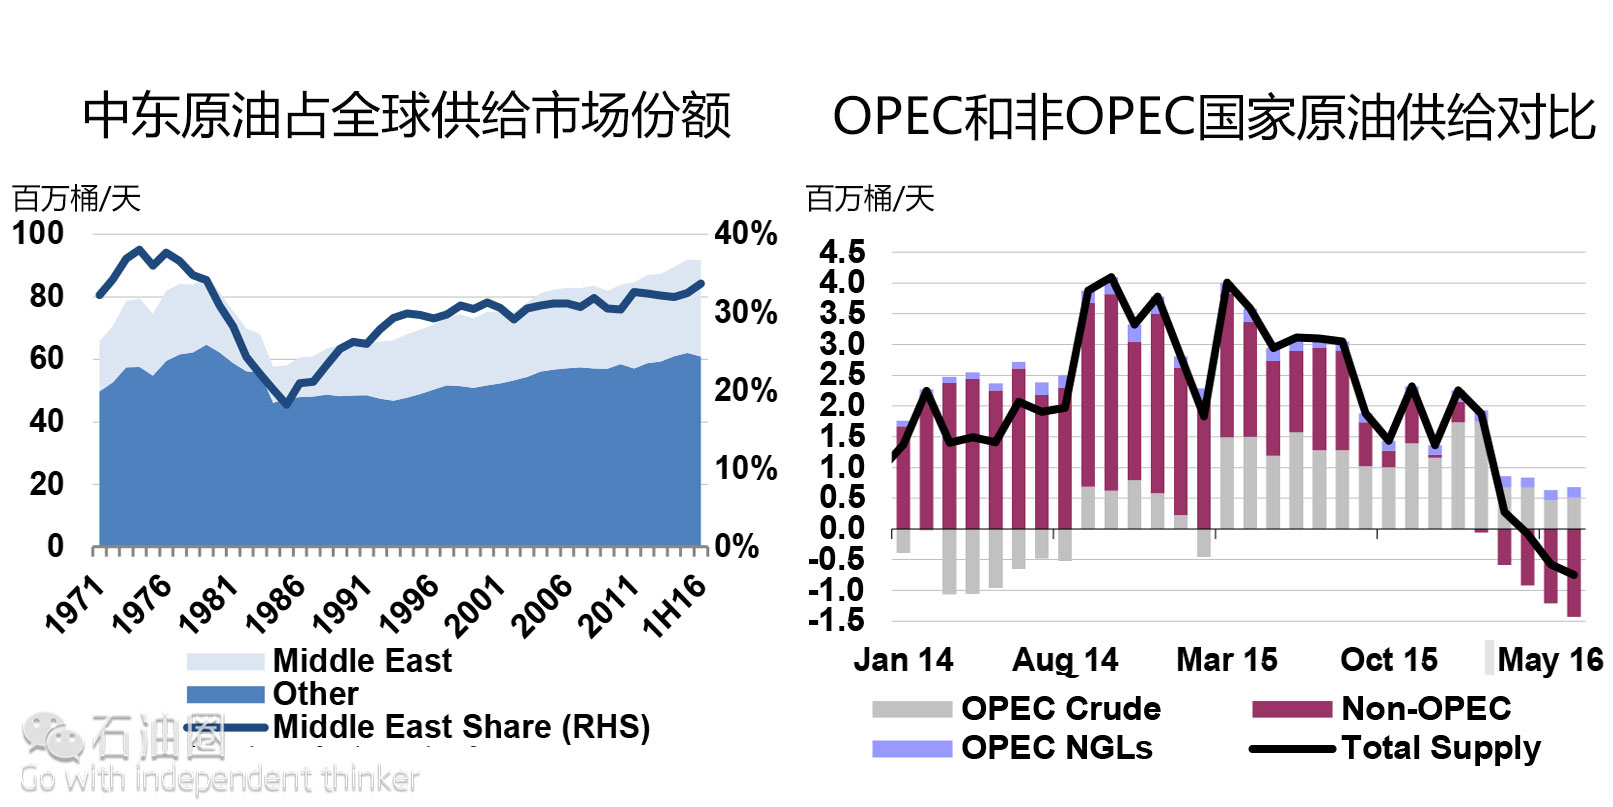
On the supply side of the balance, our forecasts for non-OPEC production have proved to be accurate so far in 2016. Non-OPEC production remains on course to fall by 0.9 mb/d this year before staging a modest recovery in 2017. For low-cost Middle Eastern OPEC countries plus other regional producers, including Bahrain and Oman, production has grown steadily in recent years, with notable increases contributed by Iraq in 2015 and Iran in 2016. In the heady days when US shale production was moving upwards very fast it became fashionable to talk of lower reliance on traditional suppliers. Our chart shows that in fact oil output from the region rose to a record high in June, with production above 31 mb/d for the third month running. As such, the Middle East’s market share of global oil supplies rose to 35%, the highest since the late 1970s and an eloquent reminder that even when US shale production does resume its growth, older producers will remain essential for oil markets.
Investment will also be important, as the IEA has regularly stated. Chevron’s announcement that it is moving ahead with a $37 billion expansion of the Tengiz field in Kazakhstan is good news, but the fact that the project will partly utilise existing infrastructure is key to making it viable at today’s oil prices. There is still an ominous investment gap building up in the oil industry that might, depending on how quickly today’s record high oil stocks are eroded, create the conditions for sharply higher prices over the medium term.
Our underlying message that the market is heading to balance remains on track, but the modest fall back in oil prices in recent days to closer to $45/bbl is a reminder that the road ahead is far from smooth.
DEMAND
Estimates of global demand for 2016 have been raised by 0.1 mb/d since last month’s Report, to 96.1 mb/d, an upgrade largely attributable to Europe’s resilience. Growth of approximately 1.4 mb/d is now envisaged in 2016.
Into 2017, global demand is forecast to rise by a further 1.3 mb/d to 97.4 mb/d. The majority of the projected upside in 2017 is attributable to non-OECD consumers, chiefly in Asia, with India’s demand forecast to be the world’s most rapidly growing in 2017, rising by 280 kb/d, closely followed by China.
European oil consumers offered the biggest 2Q16 demand surprise with preliminary data showing demand rising at a five-quarter high of 240 kb/d year-on-year (y-o-y) as relatively low crude oil prices continued to offer support.
Estimates of US oil demand have been modestly revised, with 25 kb/d added to the 2016 estimate and 35 kb/d for 2017. Official data for April fell below expectations, but preliminary May-June demand numbers exceeded our forecasts while manufacturing business sentiment indicators posted surprising mid-year optimism.
Japanese consumers provide the biggest decline in demand in 2Q16, with total Japanese demand falling by 205 kb/d y-o-y, pulled down mainly by oil’s retreat from the power generation sector.
The recent deceleration in Chinese demand growth continued into May, as y-o-y gains eased back to 130 kb/d (just over 1%), due to softness in gasoline and diesel demand.
Global Overview
Rising by 1.4 mb/d in 2016, our global demand estimate has been hiked by 0.1 mb/d compared to last month’s Report to 96.1 mb/d. Demand grew by 1.6 mb/d in 1Q16, and we have revised up our 2Q16 number to 1.4 mb/d, feeding through into the higher number for 2016 as a whole. Compared to the stellar growth for 2015 as a whole at 1.8 mb/d, 2016 is clearly seeing slower growth, but is still solid in historical terms. Growth in 2016 is underpinned by Europe and what seems to be solid strength in India.
On a product-specific basis, gasoline’s previous dominance has waned recently, with its share of global oil demand growth declining from over a half in 4Q15, to 45% in 1Q16 and an estimated 35% in 2Q16. Notably lower rates of decline in residual fuel oil demand proved a central catalyst, as did sharp upticks in LPG (including ethane), while additional gasoil/diesel demand also provided support in 2Q16. Although remaining substantial in 2Q16, global gasoline demand, 0.5 mb/d higher than the year earlier, is only equivalent to roughly half its 3Q15 gain. Sharply decelerating Chinese demand is the main factor slowing down gasoline, alongside significant slowdowns in Brazil, the US, Japan and Saudi Arabia.
The sharp declines in residual fuel oil demand that plagued 2015, with global deliveries averaging 0.2 mb/d less than the year earlier, were abated or reversed in 1H16 on easing European declines and rising US fuel oil deliveries. Additional demand in Europe and the US supported sharply accelerating LPG demand, as global 1H16 gains doubled compared to 3Q15. Only after a difficult 1Q16 – when demand eased by 0.2 mb/d – did global gasoil/diesel rebound, adding 0.4 mb/d y-o-y in 2Q16, as European demand significantly accelerated whereas the previous sharp declines in US diesel demand eased.
The moderation in global demand growth that has taken place since the peak mid-2015 looks set to continue through 2017, albeit decelerating only very modestly from early 2016. Prospective global oil demand growth eases to 1.3 mb/d in 2017, as global deliveries average 97.4 mb/d. Just over 90% of the 2017 global oil demand growth is attributable to non-OECD consumers, the rest in the much slower growing OECD. Potentially higher crude oil prices act as a break on the rate of future demand growth, although there is considerable uncertainty as to how fast – if at all – oil prices will rise. The result of the UK referendum on membership of the European Union has added to the uncertainty. At this stage, it is difficult to draw conclusions about the short-term impact on oil demand of the UK’s decision to leave the EU. In the coming weeks we will be watching this issue closely to see if there is any impact on our 2016 and 2017 demand outlook.
Notable 2Q16 data upgrades, compared to the numbers in last month’s Report, include Canada (+105 kb/d), France (+90 kb/d), the Netherlands (+35 kb/d), Australia (+60 kb/d) and Korea (+25 kb/d). Partially offsetting 2Q16 downgrades were seen in Japan (-180 kb/d), India (-100 kb/d), the US (-45 kb/d) and Belgium (-30 kb/d). Historical OECD baseline revisions, following the comprehensive updates from the IEA’s statistical division, based on revised data from member countries, respectively added 85 kb/d and 35 kb/d to the 2014 (45.8 mb/d) and 2015 (46.2 mb/d) OECD demand estimates.
SUPPLY
Summary
Global oil supplies rose by 0.6 mb/d in June, to 96 mb/d, after outages curbed OPEC and non-OPEC supplies in May. World production was 750 kb/d below a year-earlier as robust output in the low-cost Middle East was not enough to offset declines elsewhere. Middle Eastern oil production rose to a record-high of 31.5 mb/d in June, lifting its market
OPEC crude output rose by 400 kb/d in June to an eight-year high of 33.21 mb/d, including newly re-joined Gabon. Saudi Arabia ramped up to a near-record rate of 10.45 mb/d and Nigerian flows partially recovered from rebel attacks. Middle East producers sustained record pumping rates, consolidating market share and pushing OPEC’s total output 510 kb/d above a year ago.
Iran has made swift post-sanctions gains, with production in June up by 750 kb/d since the start of the year. By contrast, supply in cash-strapped Venezuela is declining fast. Output in June slipped to 2.18 mb/d – down 240 kb/d on the previous year.
Non-OPEC oil production is estimated to have increased by 205 kb/d in June, to 55.9 mb/d, following a partial recovery in Canadian oil production and seasonally higher biofuels output. Total supplies nevertheless stood more than 1.4 mb/d below a year earlier, with notable declines in the US, Canada, China and Colombia.
The forecast for non-OPEC supply is essentially unchanged since last month’s Report, with supplies declining by 0.9 mb/d in 2016 to 56.5 mb/d, before a slight recovery lifts output by 0.2 mb/d – to 56.8 mb/d in 2017. A tentative improvement in business sentiment and activity supports our view that output declines will ease in the coming months before growth returns in 2017.
All world oil supply data for June discussed in this report are IEA estimates. Estimates for OPEC countries, Alaska, Mexico and Russia are supported by preliminary June supply data.
PRICES
Crude oil prices eased from an early June peak above $52/bbl, but traded within a $45-$50/bbl range. Growing uncertainty over the global economy and the related dollar strength weighed, but the downside was limited by further declines in US production and inventories. Supply disruptions in Canada and Nigeria began to ease, but ongoing militant attacks in Nigeria made for a fragile recovery.
Spot crude markets also eased from earlier highs, as a partial recovery in Nigerian and Canadian production added pressure. Dubai flirted with contango as refiners in Asia geared up for seasonal maintenance, potentially dampening demand. Saudi Aramco cut monthly formula prices to Asia and the Mediterranean to stay competitive versus other Middle East producers.
Spot product prices continued to strengthen in June in line with crude prices that firmed month-on-month (m-o-m). Nonetheless, there appears little chance of a repeat of last year’s spike in gasoline cracks, as price increases for gasoline were less than for other products due to high stocks and concerns over gasoline demand in key markets. Moreover, as diesel prices increased relatively strongly in June, European and Asian gasoline and diesel cracks traded at parity for the first time in more than a year.
Freight rates for very large crude carriers on the Middle East to Asia route hit their lowest in more than a year as tanker supply was abundant and weather delays in the Far East eased.
REFINING
May global refinery throughput plunged by almost 1 mb/d on a month-on-month (m-o-m) basis, down 1.5 mb/d year-on-year (y-o-y), as heavy outages took their toll in many regions. This lowered 2Q16 estimate for global refinery intake, to 78.54 mb/d – the first y-o-y drop in three years.
Our forecast for 3Q16 throughput is more steady at 80.95 mb/d, up on the previous quarter by 2.4 mb/d, the largest-ever seasonal ramp-up, and by 1 mb/d y-o-y.
Refinery throughput growth is decoupling from demand growth, both seasonally, and structurally, resulting in the need for a more nuanced interpretation of headline oil demand numbers.
Global refinery overview
The latest estimate for April refinery runs is lower by 145 kb/d as the US data is revised down by 130 kb/d compared to the preliminary data, and Saudi Arabian crude intake continued to decline after seeing record levels in February. Only about 60% of Middle East and Latin American throughput is actualised for April, with the rest still estimated. The situation with reported data is better in other non-OECD regions, however, further revisions to April numbers cannot be ruled out.
Flat y-o-y, April’s unimpressive refining activity was only a prelude to a more dramatic May, when some major refining regions performed worse than expected. Global throughput in May is now estimated to be down by 1.5 mb/d y-o-y, a third of which, though, is due to force-majeure in France and Canada, where, respectively, labour strikes and wildfires curtailed refinery runs. In terms of m-o-m trends too, May’s performance stood out as the usual seasonal increase was replaced by an estimated drop of almost 1 mb/d. This coincided with a temporary tightening in crude oil markets due to the Canadian wildfires and the Nigerian shutdowns, which explained why there was not much appetite for refiners unaffected by maintenance or force majeure to ramp up runs to compensate for outages elsewhere.
Thus, after 1Q16’s 1.3 mb/d gain, the refining sector is taking a breather and dipping some 330 kb/d y-o-y in 2Q16 despite the estimated 1.4 mb/d increase in demand. In theory, this would imply substantial stock draws. In practice, a certain degree of decoupling of total demand from refined product demand has emerged over the last few years that limits the need to increase refinery output as more and more products are supplied outside the refining sector (See The burden of the light-hearted demand growth)


 石油圈
石油圈


