
近日,BP发布了最新的2016世界能源统计年鉴,该年鉴着重强调了全球能源生产和消费格局的巨大变化以及对能源价格、全球燃料结构和二氧化碳排放产生的深远影响。石油圈以统计年鉴为基础,通过9张统计图表为您带来最全面的世界能源分析。
2015年,石油、核能、水能和可再生能源的产量全部实现增长,只有煤炭产量下降了4%,经历了近几年最大的降幅。但是,CO2排放量仍然增长了0.1%。尤其需要注意的是,德国、奥地利、葡萄牙、西班牙、意大利和爱尔兰这些国家去年的CO2排放量全部呈增加趋势。
包括风能、太阳能、生物燃料等在内的可再生能源仍旧涨势迅猛,但只占全球能源总量的2.8%,这不包括只在发展中国家使用的生物燃料,化石燃料仍然是目前最主要的能源。2015年,化石燃料使用量占主要能源的86.1%,而这一数字在2000年为86.8%。
2016年6月8日,BP发布了最新的世界能源统计年鉴,下面我们将通过9张图表对全球能源产量趋势和CO2排放量进行了全面的阐述。这份年鉴给出了各种主要能源种类自1965年以来的年均产量变化趋势。为了方便对比,以下所有能源产量的单位均使用“百万吨石油当量”。
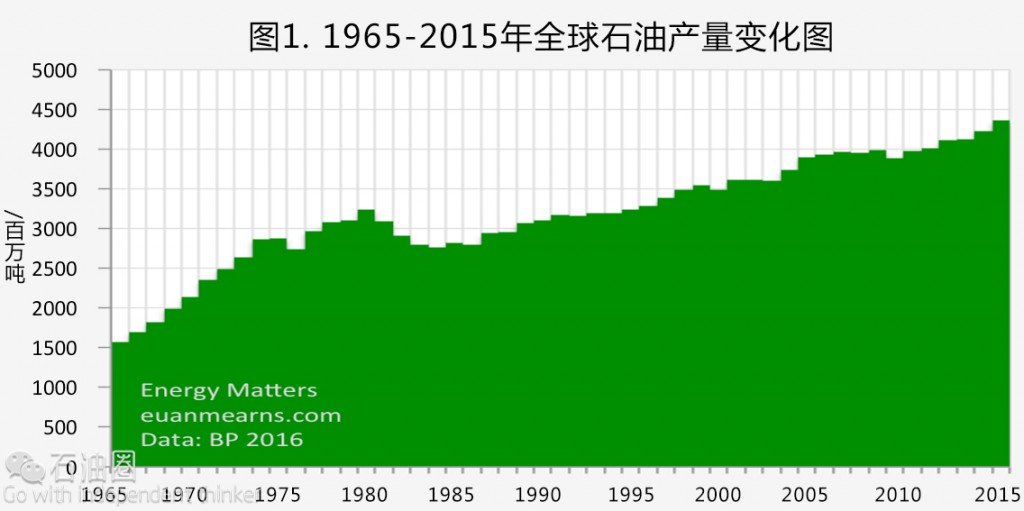
2015年全球石油产量增长了3.2%,而产量增长的原因恰恰是油价的暴跌(图1)。整个石油行业几家欢喜几家愁。其中,美国石油产量增长了8.5%,巴西增长了7.9%,英国增长了13.4%,沙特阿拉伯增长了8.5%,伊拉克增长了22.9%。另一方面,秘鲁石油产量减少了11.1%,叙利亚减少了18.2%,也门减少了67.8%,利比亚减少了13.4%,苏丹减少了12.3%,突尼斯减少了14.1%,澳大利亚减少了10.9%。而这些数字背后暗含着美国和北约外交政策的全面失败。
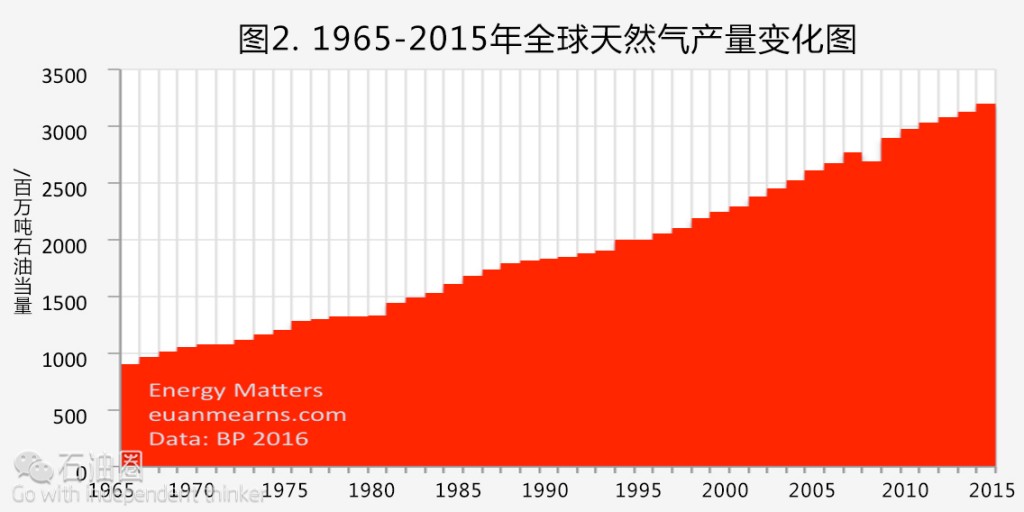
随着天然气在全球能源结构中的重要性日益凸显,全球天然气产量继续保持上升趋势(图2)。其中有几组数据十分值得注意。由于荷兰Groningen气田发生地震及地层下陷,导致该气田产量降低,进而造成荷兰天然气产量降低。荷兰天然气是欧洲最主要的能源之一。委内瑞拉的天然气产量增加了13.2%,因此,现在说委内瑞拉的能源行业即将崩溃还为时尚早。孟加拉国的天然气产量增加了12.2%,因该国继续加大对大型天然气田的开发力度。
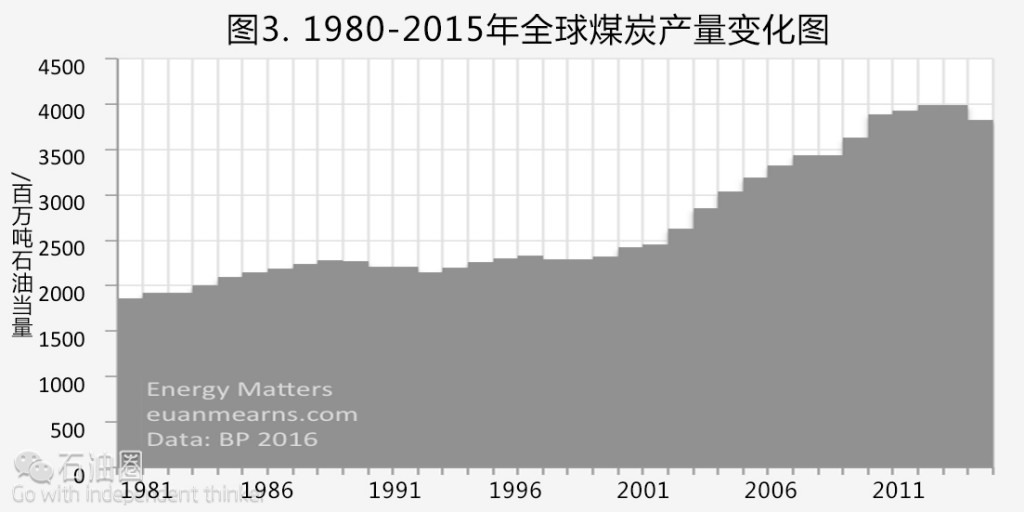
煤炭产量似乎顶峰已过,至少短期内是如此(图3)。煤炭产量下降主要有两个原因。第一,中国经济增速放缓。第二,为了降低CO2排放量,全世界正在逐步淘汰煤炭能源。去年,全球煤炭产量降低了4%。只有俄罗斯的煤炭产量增长了4.5%。其他国家,如美国、加拿大、西班牙、土耳其、乌克兰、英国、印度尼西亚和泰国,煤炭产量均降低了10%以上。而作为最大产煤国的中国,其煤炭产量下降了2%。
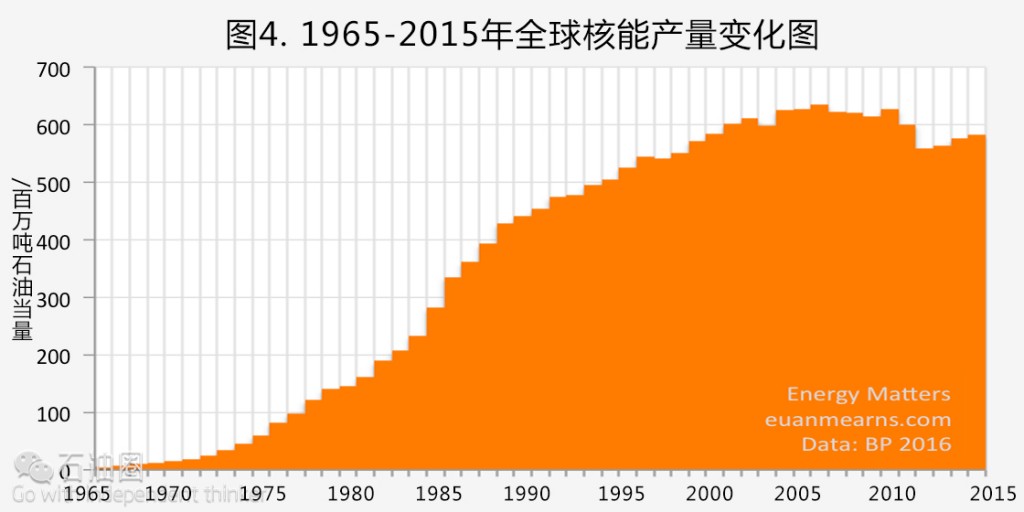
值得注意的是,全球核能产量再次回到了上行通道。目前在建核电站的核电装机容量高达69 GW,这就意味着核能的增长趋势还将继续(图4)。其中,核能增速最快的国家为中国和印度,其增速分别为28.9%和9.5%。而比利时、德国、瑞典和瑞士的核能产量均出现下降。
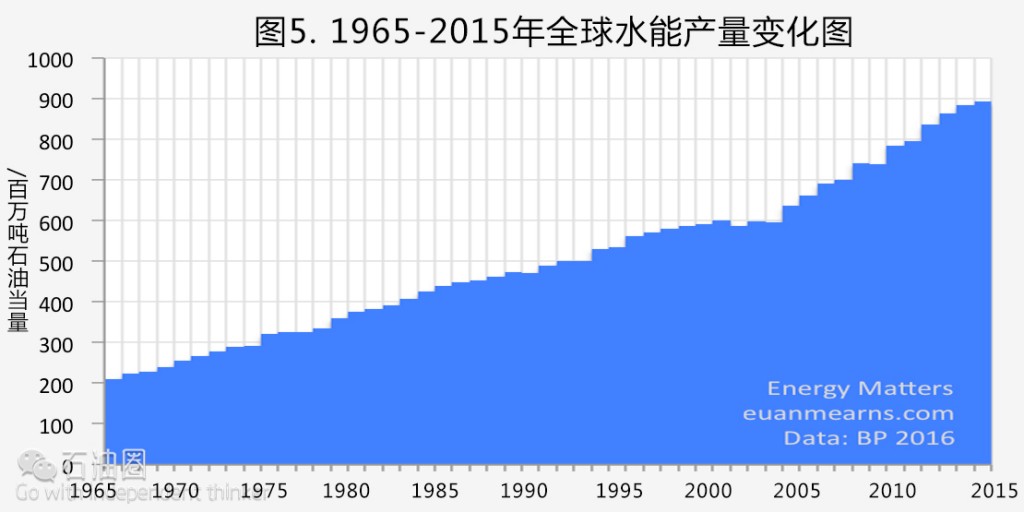
2015年全球水能产量增长了1%(图5)。但是,由于各地区降雨量难以准确获取,因此各个国家的具体水能产量增速数据并不十分准确。据估计,土耳其的水能产量增加了64.6%,印度尼西亚增加了5.9%,中国增加了5%。
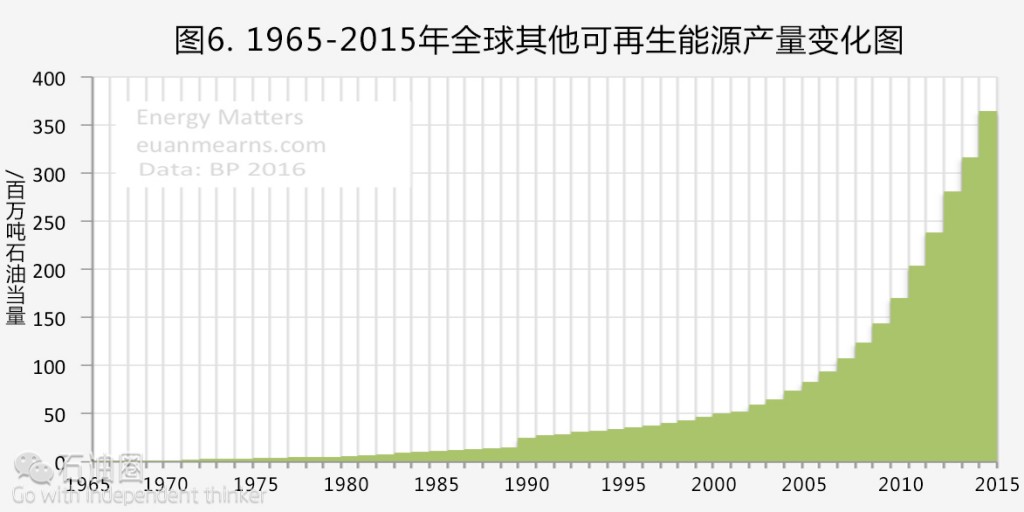
其他可再生能源包括风能、太阳能、地热能和生物燃料。尽管其他可再生能源产量2015年15.2%的增速低于2011年20%的增速,但是增长趋势依旧十分迅猛(图6)。其他可再生能源的产量增速为48.3百万吨石油当量,而石油产量增加了133.2吨,天然气增加了69.3百万吨石油当量,煤炭产量降低了158.8百万吨石油当量。
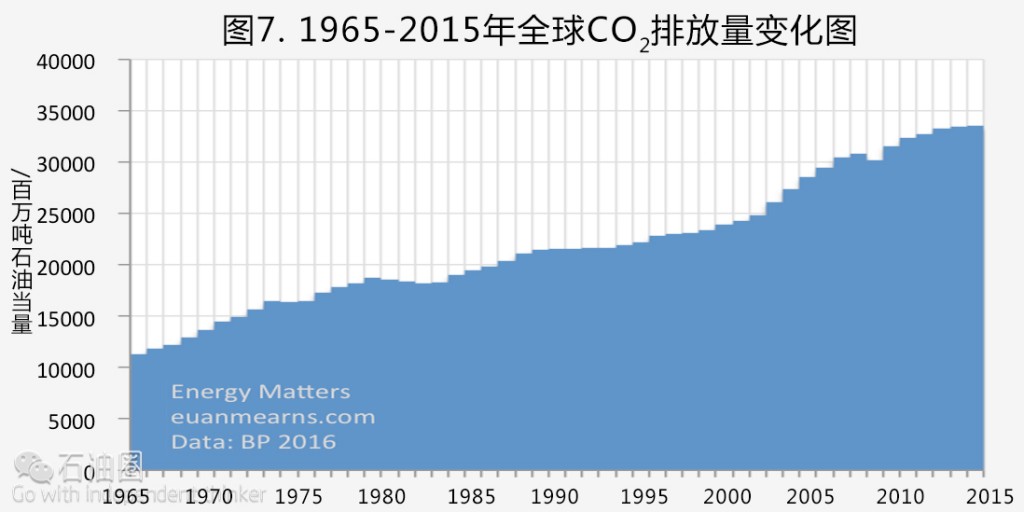
由于天然气和可再生能源在发电领域逐渐取代煤炭,以及中国经济结构不断优化。在过去5年间,全球CO2排放量增速已经开始下降(图7)。其中,德国CO2排放量增加了0.8%,奥地利增加了3.6%,葡萄牙增加了7.6%,西班牙增加了6.8%,意大利增加了5.1%,爱尔兰增加了5.4%,中国降低了0.1%。
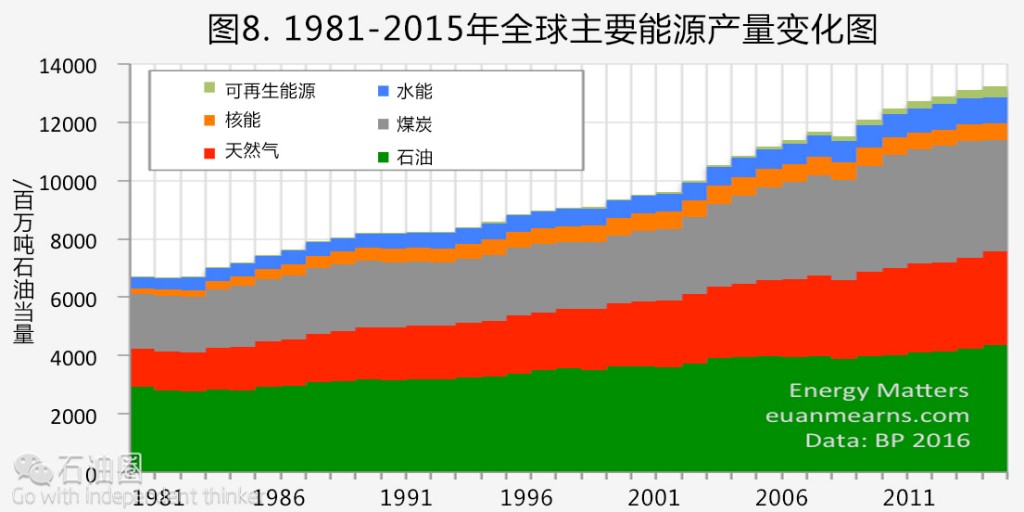
全球主要能源产量似乎正在放缓,这很可能是受到中国经济转型的影响。化石燃料占2015年全球能源总产量的86.1%,略低于2000年的86.8%,仍然是全球最重要的一种能源(图8)。
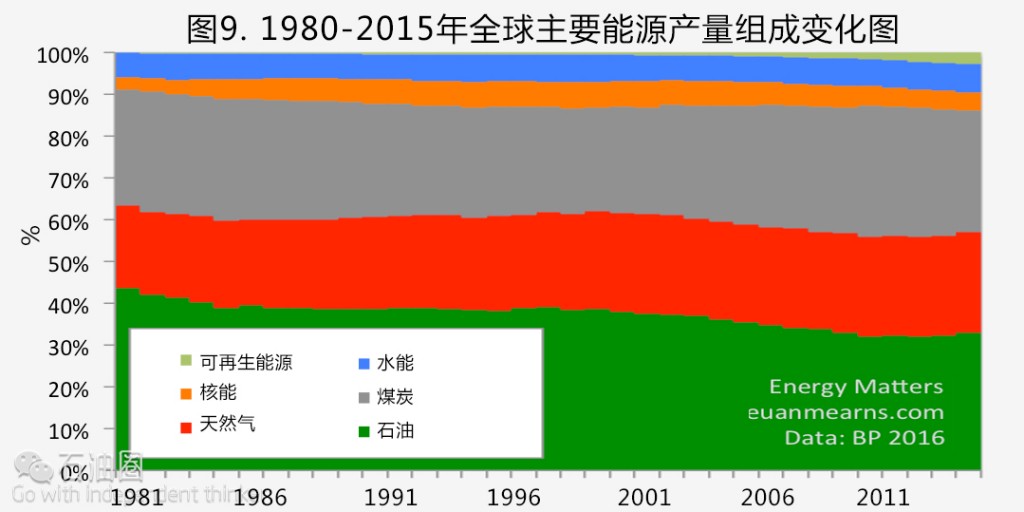
尽管可再生能源增速明显,但是在全球能源结构中仍然显得无关紧要。2015年,全球可再生能源产量占全球能源总产量的2.8%,略高于2014年的2.4%(图9)。
总之,由于近期国际原油价格反弹,公众尤为关注石油以及其他化石能源储量的最新数据。从全球化石储量来看,石油、天然气、煤炭储量丰富,尤其是煤炭储采比达到114年;而是石油、天然气的储采比也分别达到50.7年和52.8年,并无资源“耗尽”压力。公众可以少一些对能源短缺的担忧,而对中国而言,中国的能源消费增长已降至1998年以来的最低水平,但同时仍为全球最大的能源增长市场。
作者/Euan Mearns 译者/张强 编辑/Wang Yue
Oil, gas, nuclear, hydro and new-renewables production all grew in 2015 while coal production declined by 4%, the first significant decline for many decades. But global CO2 emissions were still up by 0.1%. Notably, CO2 emissions rose in Germany, Austria, Portugal, Spain, Italy and Ireland.
New renewables (wind, solar, biomass etc) continue their meteoric rise from a feeble base and still only represent 2.8% of the global energy mix (that excludes biomass used throughout developing countries). Fossil fuels still dominate with 86.1% of primary energy in 2015 compared with 86.8% in the year 2000.
The BP statistical review of World Energy was published on 8th June. This post gives a broad overview of energy production trends and CO2 emissions in 9 simple charts. BP provide annual averages for all major energy classes with series that begin in 1965. All charts are plotted using million tonnes of oil equivalent (Mtoe) which is a means of allowing apples to be compared with oranges.
Figure 1 One may be tempted to say that global oil production rose by 3.2% despite the rout in oil prices. The reality is that a 3.2% rise in global oil production caused the rout in oil prices. There are some big winners and losers. The USA was up 8.5%! Other winners include Brazil up 7.9%, the UK up 13.4%, Saudi Arabia up 4.6% and Iraq up 22.9%. The big losers are Peru down 11.1%, Syria down 18.2%, Yemen down 67.8%, Libya down 13.4%, Sudan down 12.3%, Tunisia down 14.1% and Australia down 10.9%. Embedded in these figures is a story of total failure of US and NATO foreign policy.
Figure 2 Global gas production continues its upwards march as it becomes increasingly important in the global energy mix. There are a couple of noteworthy statistics. Dutch gas production is down 22.8% as the Dutch authorities reduce production from the Groningen gas field owing to subsidence and earthquakes that were causing structural damage. This is one of Europe’s major primary energy sources. Venezuela was up 13.2%. Rumours of that country’s undoing are perhaps premature. Bangladesh was up 12.2% as that country continues to exploit its large gas reserves.
Figure 3 Coal production looks as though it may have peaked, at least in the near-term. It has succumbed to two major forces. The first is the ending of the industrialisation phase of the Chinese economy. The second is international pressure to phase out coal because of concern over CO2 emissions. Global coal production was down 4%. There is one noteworthy winner in Russia where production was up 4.5%. Elsewhere the USA, Canada, Spain, Turkey, Ukraine, The UK, Indonesia and Thailand all posted double digit % losses. Production in China, the world’s largest producer by far, was down 2%.
Figure 4 Notably, global nuclear power production is once again on a rising trend. With 69 GWe of new power stations under construction this is a trend that may continue. The big winners in nuclear power production are China up 28.9% and India up 9.5%. The big losers are Belgium, Germany, Sweden and Switzerland.
Figure 5 Global hydro production was up 1% and the overall upwards trend must clearly reflect growing global capacity. But it is more difficult to make sense of the annual figures for individual countries since these are heavily impacted by rainfall patterns. The only countries that appear to have expanded capacity are Turkey up 64.6%, Indonesia up 5.9% and China up 5%.
Figure 6 The other renewables category includes wind, solar, geothermal and biofuels. The meteoric rise continues though the +15.2% rise in 2015 compares with +20% in 2011. The absolute gain of 48.3 Mtoe needs to be compared with oil up 133.2 tonnes, gas up 69.3 Mtoe and coal down 158.8 Mtoe.
Figure 7 The rate of growth in CO2 emissions has slowed in the last 5 years as gas and renewables substitute for coal in power generation and the Chinese economy evolves. Notable statistics include Germany up 0.8%, Austria up 3.6%, Portugal up 7.6%, Spain up 6.8%. Italy up 5.1%, Ireland up 5.4% and China down 0.1%.
Figure 8 The rate of growth in global primary energy production appears to be slowing which most likely reflects the changing face of the Chinese economy. Primary energy is still overwhelmingly dominated by fossil fuels that accounted for 86.1% of global energy production in 2015. This compares with 86.8% in 2000.
Figure 9 While the growth in new renewables looks spectacular (Figure 6) they remain insignificant in the global energy mix amounting to 2.8% of the total in 2015 compared with 2.4% the year before.
未经允许,不得转载本站任何文章:
-

- 甲基橙
-
石油圈认证作者
- 毕业于中国石油大学(华东),化学工程与技术专业,长期聚焦国内外油气行业最新最有价值的行业动态,具有数十万字行业观察编译经验,如需获取油气行业分析相关资料,请联系甲基橙(QQ:1085652456;微信18202257875)


 石油圈
石油圈


