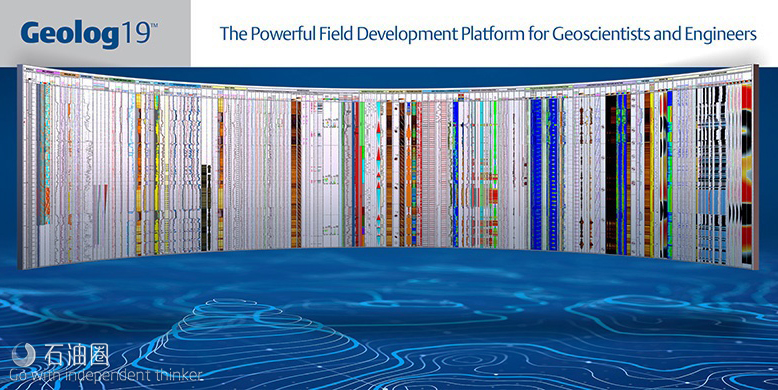
Geolog 19 delivers expanded functionality to petrophysicists, geologists and engineers throughout the entire well life cycle
Emerson announced today the release of Geolog? 19, the latest version of its formation evaluation software suite. Geolog 19 will be unveiled at the 60th Annual Society of Petrophysicists and Well Log Analysts (SPWLA) Symposium, to be held June 15-19 in The Woodlands, Texas.
This release includes new display formats that enhance collaboration between subsurface specialists. This includes representation of zonal data as crossplot and histogram tracks so that geoscientists can better understand the relationships between rock formation pressures, stresses, and mud weights, for example. The release also enhances its data connectivity and “openness” features with direct streaming of wellsite information transfer standard markup language (WITSML) data into Geolog’s geosteering application, expanded connectivity to third-party applications, including Petrel* 2019, and the integration of Python scripts for enhanced customization with no separate installation.
Additional innovations include:
1.Streamlined processing and interpretation workflows for acoustic waveform data.
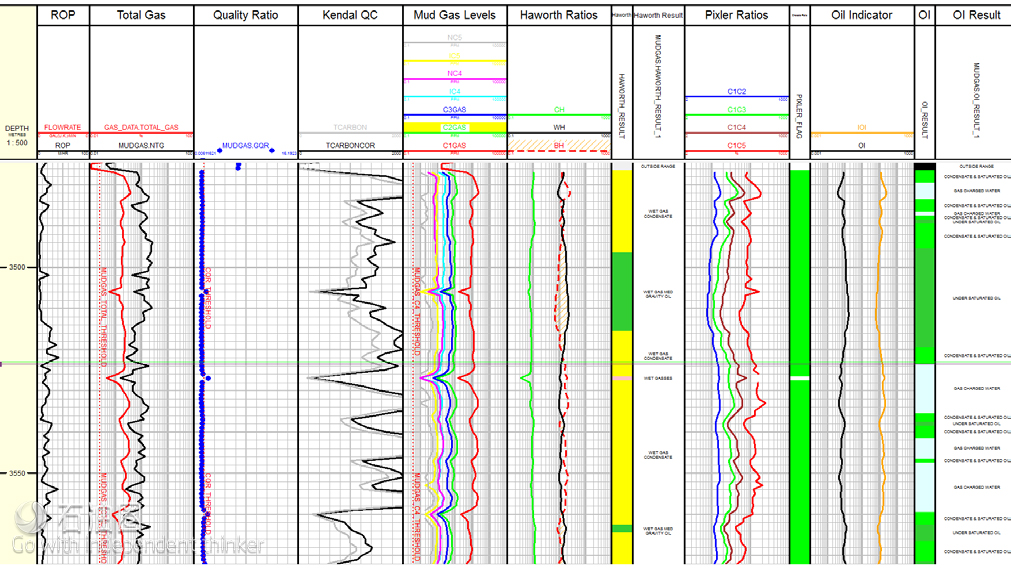
2.A new mud gas analysis module provides key information about hydrocarbons in drilled formations and allows safer drilling through early detection of gas kicks and lost circulation.
3.The ability to translate equations from Geolog into the Roxar? RMS geoscience and reservoir engineering collaboration platform and SKUA-GOCAD? modeling solution, as well as the Python, Petrel and Excel formats.
Emerson’s exploration and production software portfolio and cloud-based platform integrate and forecast oilfield data with production and reservoir engineering fundamentals. They are designed to help operators increase efficiencies and achieve Top Quartile performance on investment and operational goals within new and established oil and gas reservoirs. Top Quartile performance is defined as achieving operations and capital performance in the top 25 percent of peer companies.
Geolog has a uniquely powerful multi-well database that is able to handle large numbers of wells at a level of efficiency that is unmatched in the industry. The powerful new tools in Geolog 19 make it even easier to find, visualize, and process data across these large well databases.
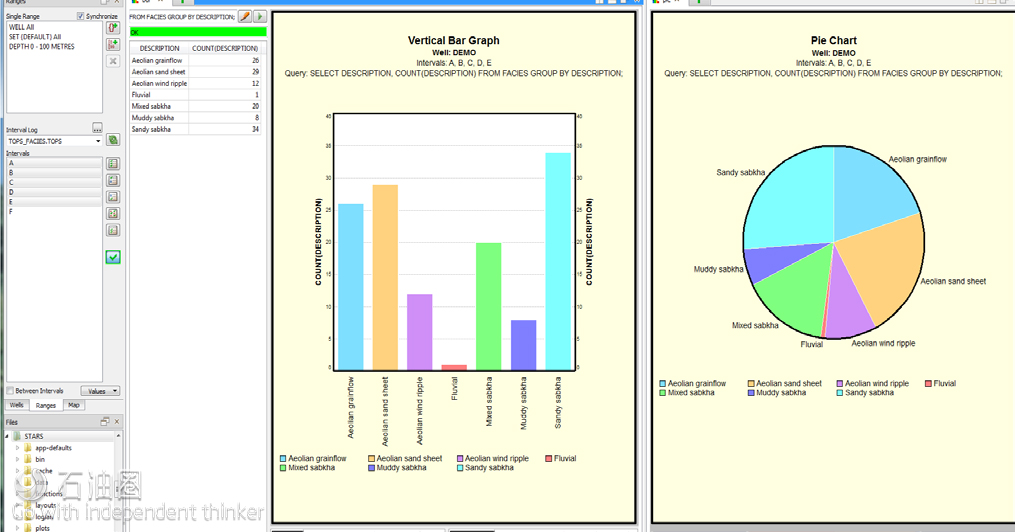
Query and Graph View
Find, report and create new data subsets using a new Query view.
Save queries for future reuse in the Graph and Report views.
The Graph view can display results in a variety of interactive plot formats, including pie, doughnut, bar, line and scatter plots.
Results are presented in a table that can be either saved in the well database or exported in text format.
Create GeologSQL queries for use across multiple wells, intervals and sets.
Easy to interactively find, visualize, and process the data across a large well database, and efficiently display the reports in a variety of formats
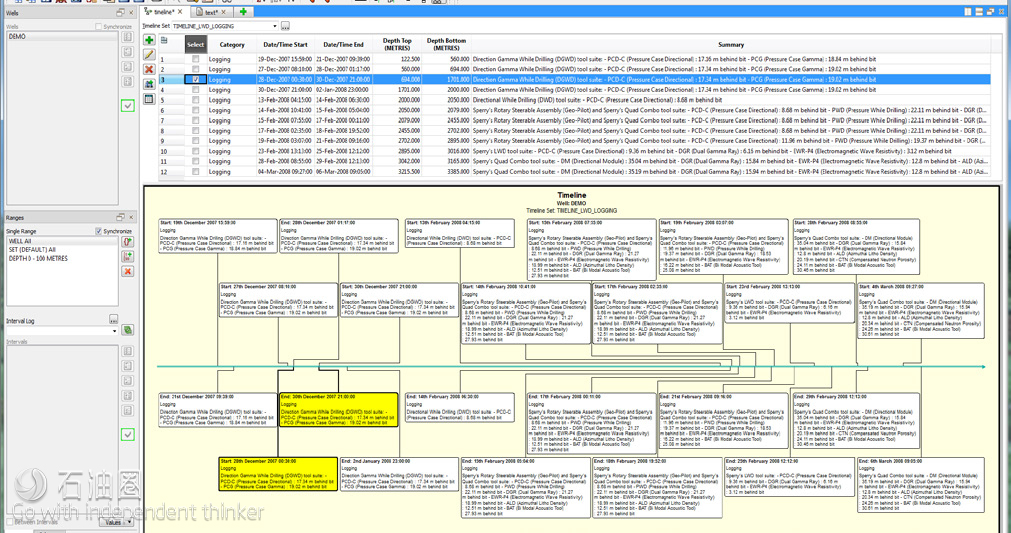
Timeline View
Provides an interactive visual representation of the main operational activities that are completed, in progress, and proposed on a given well.
Allows easy visualization and assessment of the operational history and planned activities for each well.
Shows important and useful information that helps geologists, petrophysicists, and engineers perform their daily tasks, and enhances collaboration between them throughout the different stages of the well’s life cycle.
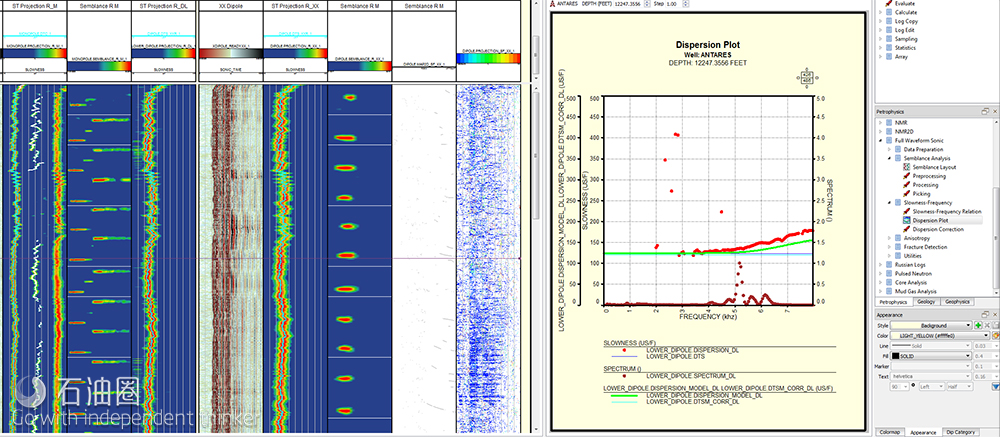
Improved Full Waveform Sonic processing
The Geolog Full Waveform Sonic processing functionality menu has been reorganized and improved.
Additional data preparation modules grouped by vendor acoustic tools
Modules that combine typical tasks Predefined layouts.
Improved ease of use when processing and interpreting acoustic waveform data
Mud Gas Analysis Module
A new module in the Determin petrophysics product suite.
Allows the computation of several output logs and flags, such as Pixler flags and gas ratio curves using gas chromatography inputs.
Provides key information about hydrocarbon present in drilled formations.
Allows safer drilling by early detection of gas kicks and lost circulation.
Direct Streaming of WITSML Data into Geolog Geosteer
Real-time data in WITSML format can be streamed directly into the Geolog Geosteer module.
Data files stored on disk in WITSML format can also be loaded through Geolog’s File Importer module.
Greater flexibility in setting up a real-time geosteering environment
Layout Enhancements
Crossplots and histogram tracks
Numerous new visualization options and data editing/QC enhancements
Faster multi-interval statistical analysis
Fewer clicks
Python Loglan
Python package is provided with the Geolog installer – no separate download or installation required for users wishing to create Python scripts in Geolog.
Expanded access to multiple libraries that can be used
for advanced statistics, Machine Learning, and data analytics.
Python Loglans can be compiled.
Faster execution of Python programs, fewer clicks
Better security, less risk of unwanted changes to code
Connectivity Updates
Geolog connects to Petrel 2016, 2017, 2018, and 2019.
Ability to translate equations from Geolog into Roxar? RMS, SKUA-GOCAD?, Python, Petrel and Excel formats.
Continuous upgrade to Petrel connectivity
Smoother workflow between petrophysicistsmodelers and modelers

 石油圈
石油圈