根据美国能源信息署《月度能源回顾》数据库资料,2015年9月,世界原油产量比上一年同期增加了150万桶/天。增加的大部分原油产量来自以下三个国家:美国增加了44万桶/天,沙特增加了55万桶/天,伊拉克增加90万桶/天。如果这三个国家原油产量不增加的话,世界石油产量实际上比上一年同期减少40万桶/天。

图1 1973年1月~2015年9月美国每月原油产量(单位:千桶/天)
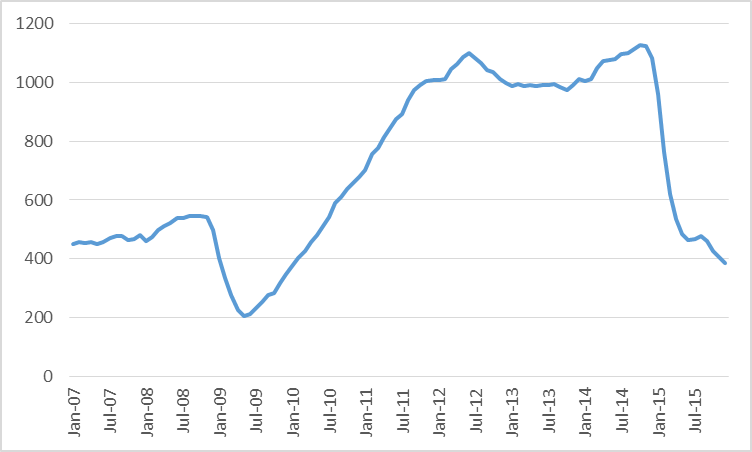
但是,2016年美国的形势将大不相同。今天美国在钻钻机数仅为2014年的三分之一。根据JODI资料估计,美国石油产量到2015年10月与上一年相比已经下降。而根据美国能源信息署的钻井生产能力模型估算,来自美国致密油产量繁荣地区郡的石油产量从9月份到下个月底可能要再下降50万桶/天。

图2 2007年1月~2015年12月美国二叠、鹰滩、巴肯和Niobrara致密油产区郡的月工作钻机数

图3 2007年1月~2015年12月美国二叠、鹰滩、巴肯和Niobrara
致密油产区郡的实际或预测平均日产量(百万桶/天)
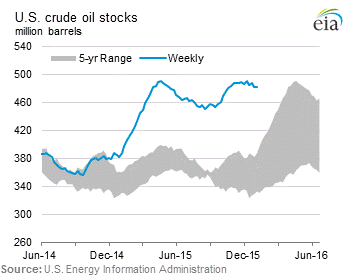
但是,在美国库存开始下降之前,很难看到油价会上涨。

图4 美国商业原油库存
目前热议最多的来自沙特的增加,仅仅使该国石油产量恢复到2013年8月的水平。

图5 1973年1月~2015年9月沙特原油月产量(单位:千桶/天)
值得注意的是沙特最近原油出口也明显地低于其近期峰值。其中一个重要因素是自2014年以来沙特增加的原油产量供应给其国内炼厂,沙特已经大规模地扩大了其炼油能力。因此,目前沙特是出口更多的炼油产品而取代原油。

图6 2010-2015年沙特原油出口(单位:千桶/天,2015年黄色,2014年红色)

图7 沙特炼油产品出口(单位:千桶/天,2015年黄色,2014年红色)
石油产量增加最多的是来自伊拉克。尽管该地区一直动荡不安,但其石油产量的增加一直令世人刮目相看。

图8 1973年1月~2015年9月伊拉克原油月产量(单位:千桶/天)
下一个原油产量增加的国家将是伊朗,其石油产量由于国际制裁一直低迷,而目前制裁正在解除。伊朗计划马上增加石油出口50万桶/天,此外伊朗在波斯湾的油轮中还储存了3000万桶的原油。

图9 1973年1月~2015年9月伊朗原油月产量(单位:千桶/天)
即使如此,来自中东的更多的新增加的石油供应很明显会影响市场。自从我上次9月份更新计算结果以来(编译者注1),美元已经针对我们的主要贸易伙伴升值了3%,而铜的价格已经下跌16%。利用这些变量与财政部这10年的数据,基于油价每周历史数据回归分析,我们可能预测WTI价格自9月以来从46美元/桶下降10%到今天的41.5美元/桶,依据是目前汇率的变化、铜价以及银行利息,解释了自9月以来下降了三分之一,而这些国际因素对石油市场是非同寻常的。
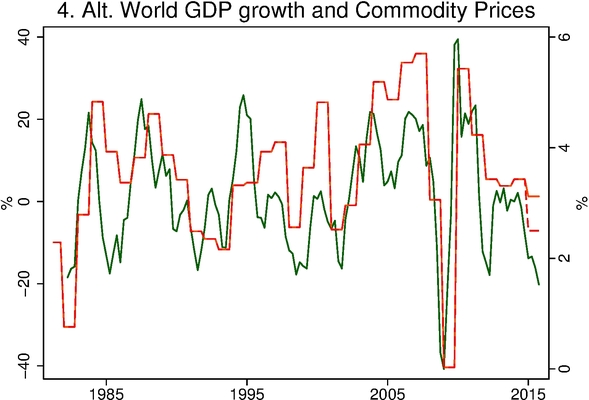
作为这些因素之一,Bob Barbera讨论过世界GDP增长放缓的影响(编译者注2)。他的如下图件表明,自2010年以来观察到的世界GDP减速可以很容易解释2014年(绿色表示)以来的大宗商品价格大幅度下跌。Barbera根据中国轨道运输量与发电量推测,2015年中国实际GDP增长可能很明显低于该国官方目标的7%。图中虚红线是Barbera的“假设分析”计算,假如我们用2.5%的实际GDP增长率代替6.8%(国际货币基金估算的)输入到中国,这就能够解释去年大宗商品价格大幅度地下跌。

图 10 国际货币基金组织估算的世界实际GDP年增长率(红色,右侧坐标轴)和大宗商品价格年变化率(由季度平均CRB/BLS工业原材料价格指数计算所得)(绿色,左侧坐标轴)。虚线是Barbera对2015年世界GDP增长的估算,如果中国的增长率为6.8%而不是2.5%的话。

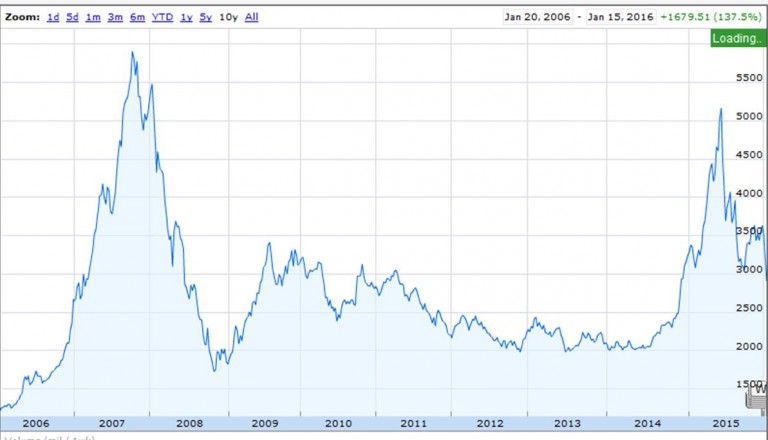
图11 上海综合股指
自去年夏天以来,中国股市下跌了44%,表明这种假设分析计算应该得到重视。
如果以来石油产量激增,伊拉克产量保持高水平,而中国经济持续低迷,只能意味着美国石油产量更大的下降将是不可避免的。
According to the Energy Information Administration’s Monthly Energy Review database, world field production of crude oil in September was up 1.5 million barrels a day over the previous year. More than all of that came from a 440,000 b/d increase in the U.S., 550,000 b/d from Saudi Arabia, and 900,000 b/d from Iraq. If it had not been for the increased oil production from these three countries, world oil production would actually have been down almost 400,000 b/d over the last year.
But the U.S. situation will be very different in 2016. The number of active U.S. oil rigs today is about a third of the levels reached in 2014. JODI’s separate database estimates that U.S. oil production was already down year-over-year by October 2015. And the EIA’s drilling productivity model estimates that production from the U.S. counties associated with the tight oil boom will have fallen another 500,000 b/d from the September values by the end of next month.
Still, it is hard to see prices increasing until U.S. inventories begin to come down.
The much-discussed increase from Saudi Arabia only puts the kingdom’s oil production back to where it had been in August 2013.
It’s worth noting that also leaves Saudi exports of crude oil significantly below their recent peak. One important factor in the increased Saudi crude production since last year was the need to supply its greatly expanded refinery capacity. As a result, Saudi Arabia is now exporting more refined products in place of crude oil.
The big story up to this point has been Iraq. The country continues to log impressive increases in production despite ongoing turmoil in the region.
And next up will be Iran, whose production has been depressed as a result of international sanctions that are now being lifted. Iran intends to increase oil exports by 500,000 b/d right away, in addition to the 30 million barrels Iran has stored in oil tankers in the Persian Gulf.
Even so, there’s clearly more than just new oil supplies from the Middle East influencing the market. Since I last updated these calculations in September, the dollar has appreciated 3% against our major trading partners, and the price of copper has fallen 16%. Based on a weekly historical regression of oil prices on these variables along with the 10-year Treasury yield, we would have predicted a 10% drop in the price of WTI from $46/barrel in $41.50 today on the basis of changes in the exchange rate, copper price, and interest rates since September, explaining about a third of the drop in oil prices since September from international factors that are not unique to oil markets.
Bob Barbera discussed the role of slowing world GDP growth as one of those factors. His graph below shows that the observed slowdown in world GDP since 2010 (shown in red in the graph below) could easily account for much of the drop in commodity prices through 2014 (in green). Barbera speculates on the basis of the numbers for Chinese rail shipments and electricity production that the true Chinese GDP growth for 2015 may have been significantly below the country’s official target of 7%. The dashed red line in the graph below is Barbera’s “what-if” calculation supposing we impute 2.5% real GDP growth to China instead of the 6.8% number that IMF is estimating that we will see in China’s official numbers for 2015, an exercise that could explain much of the drop in general commodity prices through last year.
The 44% drop in Chinese stock prices since last summer suggests that this kind of what-if calculation should be taken seriously.
If Iranian production is about to surge, Iraqi production remains high, and the Chinese economy is stumbling, that can only mean that even bigger drops in U.S. oil production are inevitable.

未经允许,不得转载本站任何文章:
-

- 震旦能源
-
石油圈认证作者
- 第一时间提供世界能源信息与最新进展,重点关注世界油气工业,开展技术交流与成果分享。微信公众号:震旦能源(sinoenergy),设有湖说油气、专家快语、震旦综述、震旦专题、油气小知识等特色栏目,敬请关注!


 石油圈
石油圈


