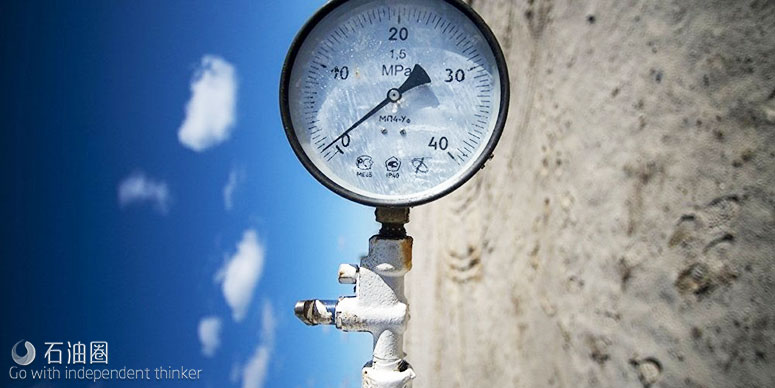
做过油藏数值模拟、做过产量模型,但是用模型制作实时“虚拟流量仪表”却是很新鲜的一种应用方式。
来自 | Worldoil
编译 | 周诗雨 影子
如果你在谷歌搜索“production optimization”,大约会返回220多万个结果。显然,这是一个大家很喜欢讨论的话题。但这到底是什么意思?
Intellidynamics公司给出了一个很有意思的定义:“生产优化本质上就是‘产量控制’,在这个过程中,你可以最大限度地减少、最大限度地提高石油天然气或者可能是水的产量,使它们达到目标产量。例如,我们可以很容易地最大化油天然气的产量,或者达到目标产量,同时最小化水的产量;或者将原油产量和气油比(GOR)保持在某一设定点,保存油藏能量。可选的产量目标是非常多元化的。由于每口井、每个平台和区块都有很大不同,所以需要应用灵活的产量控制方式。”
智能气举优化
Intellidynamics公司介绍了关于该技术的一个应用。壳牌马来西亚公司与马来西亚国家石油公司合作,将该智能气举优化技术名命名为“iGLO”,打算在马来西亚沙巴州哥打京那巴鲁北海岸的南佛罗里达和圣约瑟夫油田中使用。
在该项目中,公司对多个平台上的每口井进行了油气水生产建模,并将这些模型放在实时线上作为可视化仪表使用。这样他们就能够实时了解到油、气、水的流动情况,资产管理人员及时发现“漏掉的油”在哪里。在此之前,测试产量并不等于生产产量,有大量的油都“失踪”了。但是现在,随着生产进程的实时可见,资产管理人员可以看到,混合的油气水之间的相互作用会降低总产量,导致实际产量低于测试产量,从而也解开了一个谜题。
也许一种叫“虚拟仪表”的东西会让你挑眉。据该公司介绍,虚拟仪表是一种根据工艺情况来估算流量的数据模型,而不是使用物理仪表。虚拟计量属于一个更广泛分类-虚拟传感器-中的一种特殊情况(篇幅有限,不展开赘述)。为了创建和校准一个虚拟仪表,你需要流量数据,但是只需要一段时间的数据。一旦校准后,虚拟仪表就可以利用工艺情况来进行估算。
对于油气生产而言,物理仪表既可以安在生产分离器上,同时测量多口井的联合流量,也可以安在测试分离器上,对单独的某口井进行偶尔或临时的流量测量。在这个“测试”期间,需要采集某口井的井作业条件和生产数据,用于校准理论和/或数据驱动的非线性回归模型。一旦得到了彼此间的因果关系,就可以将模型放在线上,并使用现在的井生产条件。 然后该模型就可以实时输出产量估计值。通过这种方式,资产团队即使在未测试的情况下也可以看到每口井的产量。
那么为什么要使用虚拟仪表呢? 该公司对这个问题自有答案。“测量油气水的实体多相流量计非常昂贵,如果想要达到计数的目的,则更是如此。多相流量计的安装也同样很昂贵。 在海上平台上,它们必须通过船运或空运。另外,在纠结的管道迷宫中,可能根本没有放流量计的位置。此外,物理计量表容易受到腐蚀、砂磨,以及蜡、甲基水合物等的堵塞,需要良好的维修,而这也是昂贵的。每个平台上通常有5~15口井,如果我们在每口井上都安装这样的仪表,那么成本很显然是十分昂贵的,因此资产团队只能进行“有根据的猜测”,来估算每口井到底产量是多少。而反观虚拟仪表,它们仅仅是软件,价格更便宜,而且更容易创建和部署。”
自动自我维护虚拟仪表
正如公司所指出的那样:“即使是虚拟仪表也需要维护,因为井是会发生变化的,油藏会随着时间的推移而耗尽。在数学中,这被称为“非稳态过程”,即一个随着时间推移而变化的过程。
“在维护一个虚拟仪表时,我们偶尔会进行井测试,对比模型给出的产量与物理仪表给出的产量,然后对模型进行调整或重新拟合。为了做到这一点,我们自动监测一个井测试,捕获数据,将其与模型估算的油气水产量进行比较,然后要么进行模型调整减少它们之间的误差,要么当误差很大时利用新数据和较近期的一些测试数据进行重新建模。这一切都“自动”运行的(自动,无人值守)。我们也有测量所有生产井总产量的平台仪表。我们可以不时地将虚拟仪表估计的总量与流量表测量的总和进行比较,并使用各种“狡猾”的算法来调整单井的估计值。”
您也有让人挠头的难题需要解决,或是优质技术想要找应用市场吗?如果有的话,欢迎联系小编微信或邮箱,也许能找到一剂良药。
二丫:131-3255-0596;zhanglingyu@raiborn.com
大安:131-3203-1392;lishian@raiborn.com
For English, Please click here (展开/收缩)
A Google search of “production optimization” returns about 2.2 million results. Clearly, it’s a well-discussed topic.
But, as some wag once asked about “diddy wah diddy,” what does it really mean?
Intellidynamics steps in with a useful definition: “Production optimization is essentially ‘production control,’ where you minimize, maximize or target production of oil, gas and perhaps water. For example, you can easily maximize or target the production of oil and/or gas while minimizing water, or run oil production and gas-oil ratio (GOR) to set points, to maintain reservoir energy. There are a myriad of alternative production objectives. Since each well, platform and field are quite different, a flexible means of controlling production is provided.”
Intelligent gas lift optimization. The company describes an application of this idea. Shell Malaysia, in conjunction with Petronas, gave this capability the name “iGLO” for Intelligent Gas Lift Optimization, when they applied it to the South Furious and Saint Joseph fields off the north shore of Kota Kinabalu, Sabah, Malaysia. In this project, [the company] modeled oil, gas and water production for each well on multiple platforms, and put those models online, in real time, as virtual meters. This gave them insights about where oil, gas and water were coming from in real time. The asset manager immediately discovered “lost oil.” Previous to this, test rates did not sum to production rates; a notable amount of oil had “gone missing.” But now, with visibility of production in real time, the asset manager could see how, and where, co-mingled streams’ interactions decreased overall production compared to test. A mystery was solved.
Perhaps “virtual meter” arched your eyebrows. According to the company, a virtual meter is a mathematical model that uses process conditions to estimate flowrates instead of using a physical meter. Virtual metering is a special case of a broader class: Virtual Sensors (space prevents elaboration here). In order to create and calibrate a virtual meter, you do, indeed, need flow but only for a while. Once calibrated, the virtual meter can then just use process conditions to make its estimates.
In the case of oil and gas production, physical meters are either on production separators measuring conjoined flow from many wells at the same time, or on test separators that measure flow for individual wells only occasionally and temporarily. During this “on-test” time, well operating conditions and production data are acquired for that particular well. These data are used to calibrate theoretical and/or data-driven, non-linear regression models. Once the cause-and-effect relations are captured, the model can be put online using the current well operating conditions. The model then outputs production estimates in real time. In this way, the asset team can see production from each well, even when not on test.
Why use virtual meters? The company has an answer for this question, as well: “Physical multi-phase meters that measure oil, gas and water are very expensive, more so if they are good for accounting purposes. They are also expensive to install. In the case of offshore platforms, they have to be ‘barged out’ or air-lifted to the platforms. Also, there may not be space to put a multiphase flowmeter into the tangled maze of pipes. Physical meters also need to be maintained, subject to corrosion, sand, plugging with wax, methyl hydrates, etc., which can be costly as well. If you wish to have such meters on each well, and considering there are typically five to 15 wells on each platform, the cost is prohibitive and causes the asset team to make ‘educated guesses’ about how much a well is producing. On the other hand, virtual meters are software, much more affordable, and much easier to create and deploy.”
Autonomously self-maintaining virtual meters. As the company notes, “…even virtual meters need to be maintained, because the wells change, and the reservoir depletes over time. In mathematics this is called a ‘non-stationary process,’ a process that changes over time.
“To maintain a virtual meter, we use the occasional well tests to compare the rate given by the model vs. the rate given by the physical meter, and make adjustments or re-field-fit the model. To do this we automatically monitor for such a well test to occur, capture the data, compare it to the estimates (oil, gas and water production), and either adapt the models to reduce their error or, if the error is large, remodel with the new data and perhaps some of the recent past tests. This all runs ‘autonomously’ (automatically, unattended). We also have the platform meters that measure the sum of all the operating wells. We can compare the sum of the virtual meter estimates to the sum of production meters from time to time and adapt the individual wells’ estimates using a variety of ‘sly’ algorithms. Sly? Yes, because you do not want to over-adapt to the platform meters, as it may cause a loss of ‘intuitiveness’ of the individual production estimates. This, too, is autonomous.”
By the way, the story of the company’s founding is surely relatable to many of you. “In 1979, founder Carl Cook was standing in front of a control panel of a manufacturing line, three stories tall and a city block long. The line was down for making reject product. He looked over a three-ring binder ‘expert system’ that told him that if he had Problem A, turn Knob #1 up, and if he had Problem B, turn Knob #1 down. The problem was he had Problems A and B, which suggested turning Knob #1 both up and down; not doing anything. He thought to himself, ‘There must be a way…’”
未经允许,不得转载本站任何文章:

 石油圈
石油圈
