One of the beauties of waterfowl such as swans is their apparent ease in gliding across the water. Those of us on the shore observing them don’t see the effort of their webfeet paddling under the water in order to propel them from place to place. If one believes we are captive to a black-swan-world where everything we thought we knew and understood is upended by current events, then understanding how our new world works will be of great importance as we try to divine a way to a better economy and society.
In our last Musings, we wrote about crude oil prices and their relationship to lagging global economic growth. Yes, the argument is made cogently by many oil experts that the cause of today’s low oil prices is really due to an oversupply of oil caused by the rapid growth of U.S. shale oil output and not a lack of demand. The growth of shale oil has created two problems for the domestic oil business – too much light oil for our refineries to use and inflated inventories facing reduced storage capacity that adversely impacts global oil prices. The first problem may be solved over time by the ending of our ban on oil exports. Cargoes are now starting to head to Europe where a market for light oil exists, but the refiners there are cautious in using this U.S. oil because they have never processed any in their refineries. The associated storage situation may prove a greater challenge to overcome.
The surge in U.S. oil output from roughly five million barrels a day (mmb/d) in 2004 to over nine mmb/d by 2015 has significantly contributed to the currently estimated two mmb/d global oil market oversupply situation. While the supply surge has helped create an oil market supply/demand imbalance, the absence of robust demand growth is often overlooked, or believed to have had only a minimal impact, in assessing corrective market forces.
Two other factors helped drive the global oil oversupply. Those factors included high oil prices and cheap capital, the latter in response to the zero-interest rate policy of western central banks in response to the 2008-2009 financial crisis and recession. All of these factors have combined over the past 18-24 months and created the perfect oil market storm. For most people, the images of a perfect storm are associated with Superstorm Sandy that blasted New Jersey, New York and Connecticut in 2012, or from the 2000 movie, The Perfect Storm, that told the story of the commercial fishing trawler Andria Gale lost with all hands during the 1991 perfect storm in the North Atlantic.
Superstorm Sandy, a post-tropical cyclone when it made landfall the evening of October 29, 2012, along the coast of southern New Jersey, is estimated to have been the second most costly tropical cyclone on record after 2005’s Hurricane Katrina that led to the breech of the levee system protecting New Orleans and the city’s resulting flood. Sandy achieved a number of notable firsts. It had the lowest barometric reading ever recorded for an Atlantic storm making landfall north of Cape Hatteras, North Carolina.
The previous record holder was the 1938 “Long Island Express” Hurricane that devastated Long Island and Rhode Island. Sandy also created the largest surge at Battery Park, New York at 13.88 feet, surpassing the record set by Hurricane Donna in 1960 by 3.86 feet. It also created record surf in New York Harbor when a buoy measured a 32.5-foot wave, some 6.5-feet taller than the one caused by Hurricane Irene in 2011.
In terms of human measures, Sandy’s death toll along its entire hurricane and post-tropical cyclone trek totaled 147, with 72 deaths in the U.S. and the remainder in Haiti and Cuba. Financially, New Jersey and New York, the two hardest hit locales experienced in excess of $80 billion in damages, with other states and Caribbean countries adding to the damage total. What we are periodically reminded of is that all the storm damage has yet to be repaired while preparations for protecting the area against another such storm are ongoing, nearly three and a half years later. That said, people are still able to live and work in the damaged areas although they are not as they were before, much like today’s oil business.
Those seeking to explain the current state of the global oil market are most likely to point to the damage from the 2008-2009 crisis and the slow economic recovery that has been partially hobbled by government policies implemented in response – the economic version of the perfect storm. We would suggest that the roots of the current weak oil market predate 2008. We believe that the Chinese economic miracle of 2004 may have set in motion the events that have put the oil market where it is now – in a significant oversupply situation. This suggests that a solid recovery in oil prices may still be years away, even if we do bounce up from the current $30 a barrel level. This fits with the admonition that Saudi Arabia Minister of Petroleum and Mineral Resources Ali Al-naimi delivered during his talk at the recent CERAWeek conference. Mr. Naimi said, “We should allow markets to work, but we must remain vigilant, we need to work to understand new market dynamics.” This comment came after he declared that Saudi Arabia was not about to cut its oil production to accommodate other high-cost oil sources, but rather that his country would consider freezing its production at January 2016 levels if other producers followed along.
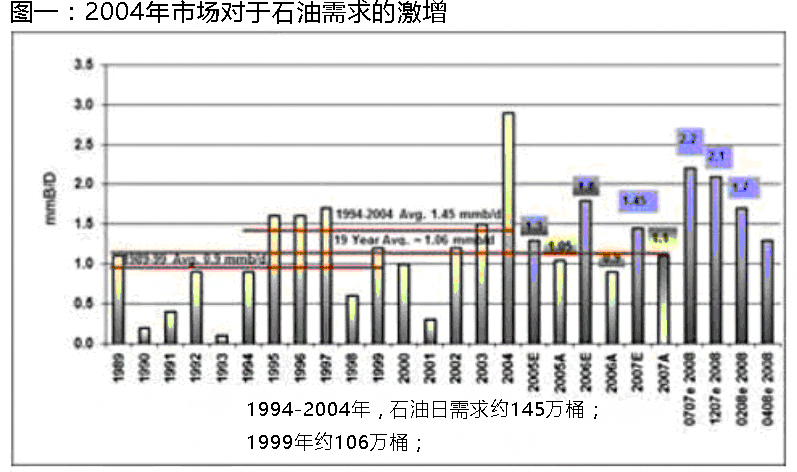
To demonstrate our point about 2004 being a turning point for the oil market, we dug back into our files and found the chart in Exhibit 1. It shows the change in annual global oil demand as reported by the International Energy Agency (IEA). The chart was put together in 2008 to demonstrate the impact that the surge in oil demand in 2004, which was underestimated by the IEA, had translated into the agency consistently forecasting greater expected demand growth than actually materialized. The series of progressively lower 2008 demand forecast revisions reflected the unfolding financial crisis that year that forecasters missed.
What the chart shows is that during 1989-1999, which included several years of meaningful annual oil demand growth from Asia prior to the 1997 Asian currency crisis, annual demand growth averaged 900,000 barrels per year. On the other hand, if we measure demand over the decade 1994-2004, growth averaged 1.45 mmb/d per year. Most telling, however, is that during the 19-year period from 1989 through 2007, which included the surge in 2004, annual demand growth averaged slightly over 1 mmb/d.
What happened in 2004? China’s economy was growing rapidly (~10%) and the country was building infrastructure in preparation for hosting the 2008 Summer Olympics. This was also shortly after China had become a net oil importer as domestic oil consumption had finally outstripped the nation’s oil output. Between September 2003, when the IEA firms up its oil demand and supply forecasts for the following year (2004), and June 2005, when the agency has finalized the figures for the preceding year, China’s demand jumped by about one mmb/d, or 18% higher. This jump came as world oil demand was revised upwards by 3 mmb/d, or 3.9% higher. In the fall of 2004, we met a then-recently-departed IEA oil demand forecaster who told us that the agency’s China and Asia forecasting models had failed woefully and were being rebuilt.
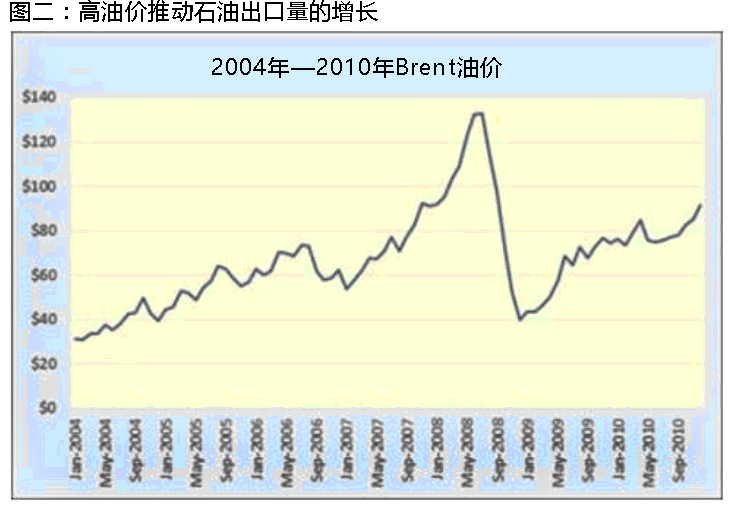
As shown in Exhibit 2, global oil prices began to climb in 2004 and rose steadily until economic difficulties arose in the latter part of 2006. Prices then resumed their climb shooting to the $130s a barrel in the spring of 2008 just before the financial crisis exploded onto the world stage. People may remember the outlandish oil price projections of that era – such as Goldman Sachs’ (GS-NYSE) forecast of oil hitting $150 a barrel – as the price approached its peak. However, despite a collapse in oil prices during the financial crisis and recession, prices quickly recovered as the optimism for strong oil demand growth remained high. It was this belief that contributed to oil prices rising to and remaining at the $100-a-barrel level for 2011-2014.
High oil prices drove drilling and production growth in anticipation of healthy oil demand growth. What people were missing, however, was that the high oil demand growth rates projected in the mid-2000s were being reduced as we moved through the following decade. The U.S. Energy Information Administration’s (EIA) Annual Energy Outlook (AEO) 2004 projected petroleum demand including liquefied petroleum gas (LPG) would grow at 1.6% per year from 2002 to 2025. If we eliminate LPG from the total, the EIA projected petroleum volumes to increase from 34.40 quadrillion British thermal units (QBtus) in 2002 to 50.42 QBtus in 2025. In contrast, the 2015 AEO calls for zero growth for petroleum in total during 2013-2040, while the LPG component grows by 1.1% per year. That means overall petroleum demand will actually decline during the forecast period! The forecast projects 2012 petroleum demand to be 31.92 QBtus, which is narrowly higher than 2040”s estimate of 31.86 QBtus. Interestingly, the EIA forecasts petroleum demand to peak in 2020 at 33.16 QBtus, making its decline to 2040 roughly -3.9%.
To demonstrate how dramatically the outlook for petroleum demand growth has changed, we compared common year demand estimates from the 2004 and 2015 AEO forecasts and found the following data points: 2015 – 43.94 vs. 32.76 QBtus; 2020 – 46.97 vs. 33.16 QBtus; and for 2025 – 50.42 vs. 32.64 QBtus. These represent forecast differences between the 2004 and 2015 AEO forecasts of -25.4%, -29.4% and -35.3%, respectively.
It is our belief that this dramatically altered long-term outlook for petroleum is at the heart of the Saudi Arabian oil strategy. High oil prices have hurt demand growth prospects while at the same time encouraging the development of high-cost, long-lived petroleum resources. These high oil prices have provided an umbrella for expensive alternative energy sources and, given the global embrace of climate change and anti-fossil fuel policies and mandates, made petroleum’s long-term outlook even less rosy. In the U.S. where producers could sell everything they produced, few gave any thought to the shifting demand outlook globally and the role that domestic production growth would play in altering that outlook.
Recognizing that the outlook for petroleum demand is lower requires a mindset change for oil company CEOs; something we sense is just now beginning to sink in. While oil CEOs talk about lowered production growth forecasts as a result of low oil prices and the forced reductions in their capital spending plans, recognition that there are substantial low-cost oil reserves in the world held by countries desperate for income is beginning to resonate. Zero production growth in a declining demand business may not be the worst outcome for oil companies. Without production volume growth, maximizing profitability becomes even more important. Determining how to organize and manage a company in this new black-swan-world of shrinking oil demand will be the real challenge.


 石油圈
石油圈

