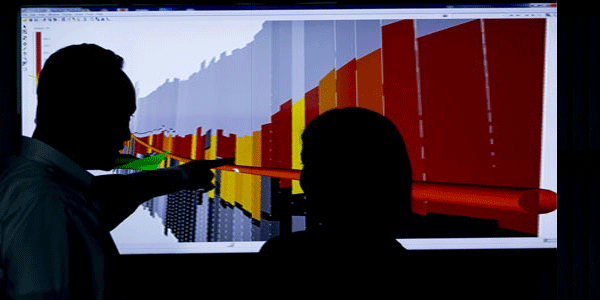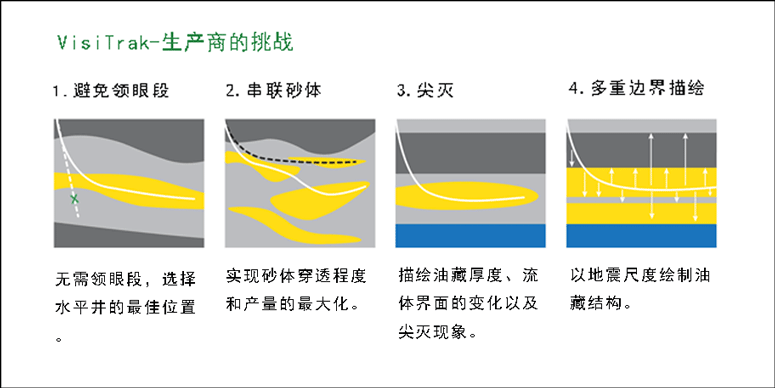
想省掉钻领眼井段的钱?想串联起多个透镜体砂体?想对油藏结构进行更准确的描绘?想要更有效更有的放矢地部属水平井?贝克休斯的地理空间导向技术及配套的分析服务,可能会为你的烦恼提供一个理想的解决方案。超深探测深度、实时随钻反演、3D可视化等,将轻松实现复杂油藏中井身结构的精准设计。
对于复杂储层,如何进行井位最优化一直以来是个大难题。当油藏的不确定性无法被降低时,其经常会导致最终采收率不尽如人意,并增加无效的生产时间。现在,贝克休斯研发出的一种新地理空间导向技术和分析服务——VisiTrak技术,可降低地震测试结果的不确定性,节省钻领眼所需的大笔开销,避免计划之外的地质侧钻,提高钻井的效率。
通常,在钻水平井段前,需要先钻一领眼对储层进行评价。而VisiTrak地理空间导向和分析服务,无需钻领眼便可实现对油层边界的实时绘制,确定油藏的结构。该服务通过读取超深方位电阻率,对复杂的地质情况进行全面的解读,同时结合先进的3D可视化技术,让用户能够更好地认识油藏结构。
同时,通过井筒周围的方位电阻率,该项技术最多可探测到井筒周围方圆30m的边界。这种惊人的探测深度可为我们提供一个清晰的油藏结构视野,地质导向的解释分析也从近井附近扩大到了地震勘探级别。这为实时的井位部属和油藏描绘提供了新的可能性。石油圈原创www.oilsns.com
地理空间分析
VisiTrak服务让人们能够更好地认识油藏结构和近井周围的砂体分布,这对于优化富油区井位部署有着重要的意义。VisiTrak采用了随钻测井(LWD)中最常见的电磁测量方法,拥有较深的探测能力。该测量方法至少需要一个发射线圈和一个接收线圈。交流电驱动发射线圈运转,由此在储层中产生交变磁场。磁场在导电岩层中产生涡电流,再生成一个二级磁场,并被接收线圈接收。接收线圈检测到的信号包含了初始信号所经过的储层信息和所使用的线圈结构信息。
该地理空间导向技术和分析服务在双模块底部钻具组合中封装了两种类型的线圈排列方式:(1)同轴差分测量(2)跨组件绝对测量。同轴测量的发射器封装在两个模块中较短的那部分,而另一个较长模块中则封装着同轴和跨组件测量的接收器和跨组件测量的发射器。石油圈原创www.oilsns.com
在同轴测量中,所有的线圈都安装在同一轴上。对于跨组件测量,其发射器与安装轴是正交安装的。两个接收器之间的信号衰减和相位差受周围介质电阻率的影响。
当介质均质时,由于其具有对称性,因此同轴的接收器接收不到任何信号;而远处的储层边界则会引发涡电流的不对称性,可以产生一个可被接收器接收到的可测量信号,这种测量正是由于不对称性而产生方位感应。

如上述同轴测量中的情况,直接信号的缺失对这种类型的测量工具来说非常有用。这样可以通过相对较小的发射器-接收器距离,达到一个较大的探测深度。发射器-接收器之间的间距缩短,模块就可以安置于钻头附近,因此我们就可以更早的测量储层边界。石油圈原创www.oilsns.com
所有的模块都以20KHz和50KHz的频率进行操作,同时也没有必要再为整个系统安装额外的井下发电器。在每一种操作频率,都可以进行远距离的相位差和衰减电阻率测量,以及方向信号强度的测量,提供井筒的360度油藏尺度的视野。
这些测量为多分量反演建模软件模拟提供了数据资料。该反演模型可以最多探测到井筒上方及下方30米处的多个边界。
案例:巴伦支海
目前位于巴伦支海的挪威大陆架已运用了该技术,并突显出了上述所述的各种优点。该油田位于哈默菲斯特(挪威北部港市)西北部85千米处,也是巴伦支海的第一个产油油藏。
该区域在靠近构造侧翼处存在大量的断层,并且构造倾角较大。Kobble储层是该油田中的一探明油藏,属于中三叠纪。该储层可以划分为两个大组,Kobble上部主要是进积型三角洲,含有河口坝和受潮汐影响的裂片;Kobble下部则更接近非均质的河流沉积,砂体的横向连续性较差。
为了实现有效的开采,需要钻水平井达到位于上覆Snadd页岩下部、厚8.5英寸的目标油藏区域,并且其井身结构需尽量避免井身着陆段与页岩层的接触以及钻遇页岩层的情况发生。为了该复杂油藏导向的准确性,需对油藏顶部进行早期探测,并准确绘制远离井筒的油藏砂体结构。

该区域生产商挑选了两个水平注气井作为最佳开发方案。Kobble储层中已钻两口水平井。油藏结构本身倾角大、裂缝多,因此为获取最佳的注气效果,井筒需贯穿所有分隔的砂体,然而在井身着陆后,井眼轨迹的狗腿度被限制在1.5度以内。
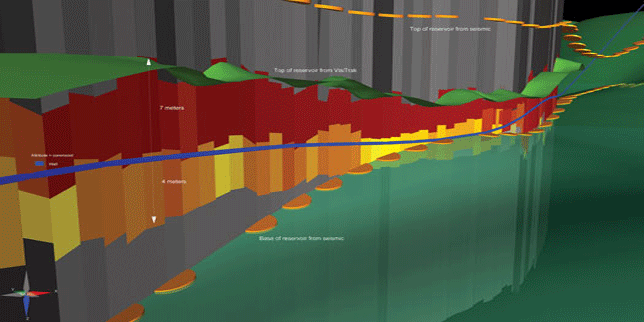
地理空间导向和分析服务在打开油藏之前,就可探测到油藏顶部约20米的实际垂深和99米的测深,由此保证了最佳的井筒着陆点。超深测量也可降低裂缝探测的不确定性。
随着探测深度的不断增加,并结合先进的多分量随钻反演技术和数据模型的3D可视化技术,这极大地提高了井位部署的成功率。油藏结构的实时绘制有利于优化井筒与油藏的接触面积。最终,水平井以平均28米/小时的钻速钻进了1000m,净毛比达到了80%。石油圈原创www.oilsns.com
现场实践证明,当油藏导向解释的范围从井筒尺度扩展到地震勘探尺度后,可以探测到常规方法五倍距离处的多重边界,为实时井位部署提供了新的可能性。同时,通过该技术,生产商可以更快地设计出钻井方案,并省去了耗时耗费的领眼,使井筒直指高产区。
In complex geological formations, optimizing wellbore placement presents a difficult challenge. Failure to mitigate reservoir uncertainty often results in suboptimal ultimate recovery and increased nonproductive time. A new geospatial navigation and analysis service increases well construction efficiency by reducing seismic uncertainty and avoiding costly pilot holes and unplanned geological side tracks.(side track A secondary wellbore drilled away from the original hole. It is possible to have multiple sidetracks, each of which might be drilled for a different reason. )
The VisiTrak geospatial navigation and analysis service makes it possible to define reservoir architecture by mapping multiple bed boundaries in real time, without the need for pilot holes that are typically drilled to evaluate the formation before drilling the horizontal portion of a well. The service combines extra-deep azimuthal resistivity readings with full interpretation of complex geological scenarios and advanced 3D visualization to provide a better understanding of reservoir architecture. Using the service, it is possible to detect remote boundaries up to 30 m (100 ft) from the wellbore with azimuthal sensitivity around the borehole. This impressive depth of detection (DOD) provides a reservoir-scale view, opening new opportunities in real-time for wellbore placement and reservoir mapping by taking reservoir navigation interpretation from near-borehole to the seismic scale.
Geospatial analysis
The service provides a unique opportunity for improved understanding of a reservoir’s architecture and its near-wellbore sand distribution, which are necessary for optimal placement of the wellbore in the most productive zones. The service is based on electromagnetic (EM) measurements that have long been used in logging-while-drilling (LWD) tools with deep-reading capabilities. The measurements are enabled by a set of at least one transmitter and one receiver coil, where the transmitter coils are driven with alternate currents to create an alternating magnetic field in the rock formation. The magnetic field produces eddy currents in the conductive rock formation. These, in turn, produce a secondary magnetic field that can be sensed at a receiver coil. The detected signal is a function of the passage of the primary signal through the formation and the particular coil geometry used.
The EDAR-based geospatial navigation and analysis service uses two types of coil arrangements housed in a two-module bottomhole assembly (BHA): (1) a coaxial differential measurement; and (2) a cross-component absolute measurement. The transmitter for the coaxial measurement is housed in the shorter of the two modules. The second, longer module contains the receivers for the coaxial and cross-component measurements, and a transmitter for the cross-component measurement.
For the coaxial measurement, all coils are aligned with the tool axis. For the cross-component measurement, a transmitter orthogonal to the tool axis is used. The signal attenuation and phase difference between the two receivers are related to the resistivity of the surrounding medium. In a homogeneous medium, symmetry prevents any signal reception by the coaxial receiver. A remote boundary introduces asymmetry in the eddy current and a measurable signal in the receiver. This measurement is azimuthally sensitive because of the asymmetry.
The absence of a direct signal, as in the coaxial measurement, is particularly useful for this type of tool, because it achieves a large DOD with relatively small transmitter-receiver distances. The short transmitter-receiver spacing positions the modules closer to the bit, which enables earlier detection of remote reservoir boundaries.
The modules operate at two frequencies-20 and 50 KHz-and there is no need for an additional downhole generator to power the system. For each frequency, long-space measurements of phase difference and attenuation resistivities are provided, along with directional signal strength measurements that provide a 360° reservoir-scale view of the borehole. These measurements provide inputs to the multi-component inversion modeling software, which supports detection of multiple boundaries both above and below the wellbore, at distances up to 30 m from the borehole.
Case study: Barents Sea
A recent project on the Norwegian continental shelf in the Barents Sea illustrates the benefits of the geospatial and navigation service described above. The field is located 85 km (53 mi) northwest of Hammerfest, and is the first oil-producing field in the Barents Sea. It is characterized by a large number of faults and a relative high structural dip toward the flank of the structure. The Kobbe formation is one of several proven hydrocarbon reservoir units in the field. It is of Middle Triassic age and is divided into two main subgroups. The Upper Kobbe is essentially a prograding deltaic system with mouth bars and tidal influenced lobes. The Lower Kobbe shifts into a more proximal, heterogeneous fluvial setting where sand bodies have limited lateral continuity.
Effective drainage of the field calls for horizontal wells, in which the 8½-in. reservoir section must be initiated in the overlaying Snadd shale. Wellbore architecture is driven by the need to minimize both shale exposure in the landing section and unwanted intra-shale drilling. Early detection of the reservoir top and accurate mapping of the reservoir sand architecture remote to the wellbore are necessary to successfully navigate this type of complex reservoir.
The operator selected two horizontal gas injectors as the best production solution. These were the first two horizontal wells drilled into the Kobbe formation. Because of the reservoir’s steep, fault-prone structure, ensuring optimal gas injection would require penetrating all compartments. However, wellbore trajectory was restricted to 1.5-degree dogleg severity after the landing.
The geospatial navigation and analysis service enabled detection of the top of the reservoir at about 20 m (66 ft) true vertical depth and 99 m (325 ft) measured depth before entering the reservoir, ensuring an optimal wellbore landing. Extra-deep measurements also helped reduce uncertainty in fault detection, where related throw can be estimated based on the displacement of boundaries. The increased DOD, combined with advanced multi-component inversion-while-drilling techniques and real-time 3D visualization of data and reservoir model, helped ensure successful placement of the well. Real-time mapping of the reservoir geometry helped optimize reservoir exposure. The operator drilled approximately 1,000 m (3,281 ft) with an average ROP of 28 m/hr (92 ft/hr) and achieved an 80% net-to-gross ratio.
As these examples illustrate, bringing reser- voir navigation interpretation from borehole to seismic scale makes it possible to identify multiple bed boundaries at five times the distance of conventional services to open new opportunities for real-time wellbore placement. As a result, operators can make faster drilling decisions to navigate to the most productive zones, while eliminating time-con-suming pilot holes.
未经允许,不得转载本站任何文章:

 石油圈
石油圈


