Less prominent shales such as the Jackson have possible commercial value if their sweet spots can be successfully identified. The method for doing so described in this article can be completed at relatively low cost. Proof of the value of these lesser known shale formations can only come through testing. Especially where essentially no chemical data are available as to kerogen and total organic compound levels and geologic maturity measurements.
With oil and gas prices down, operators, particularly independents, must strive to keep costs down to maintain value in their prospects and keep their investors. This article describes a novel approach to cutting exploration and evaluation costs while analyzing lesser known shale prospects.
Even with recent breakthroughs in shale production, lower oil and gas prices have made the economics on many of these prospects questionable. Most of the advances have focused on the drilling and production side, with exploration relatively neglected. And many of the undeveloped, lesser known shale areas continue to be overlooked.
Lesser quality or untested shale formations can be of commercial interest, but in many cases, the path to production requires expensive and time-consuming research to properly evaluate chemical makeup and geological maturity of potential pay zones. Most of these data can be obtained only during drilling by extensive coring, sampling, and custom well logging, thus increasing well costs.
This combination of upfront investments has limited exploration drilling in many untested shale areas where such data is not available.
Untested potential
The Jackson shale lies directly below the Frio Vicksburg sand and above the Yegua formation (Fig. 1). The shale is present in Texas from Fort Bend County to Duval County at 3,000-7,000 ft, with a thickness of up to 3,500 ft. The formation has been penetrated by thousands of wells, making well log data plentiful.
Jackson shale potential, however, has not been recognized by many operators. The formation has been successfully completed in only a few wells-interbedded shaly sands (Tinney and Hockley)-with many more tested that recovered noncommercial volumes of oil and gas. Sweet spots do exist, and this article provides a method of finding them using publicly available data.
Conventional wells drilled vertically to around 7,000 ft or less with fracture stimulation typically cost around $700,000 (drilled and completed). With a possible initial production of 50-100 bo/d, an operator could consider committing to horizontal drilling with multistage fracturing to increase production, but must first achieve a better understanding of the shale’s chemical makeup.
Public data
The minimum information needed to locate productive sweet spots can be found in a well log with resistivity and self-potential (SP) curves. A 1-in. log is sufficient. For Texas’ Gulf Coast, all well logs provide these curves. Additional logs, such as gamma ray or a density-neutron-sonic log enhance interpretation.
A prospect can be keyed off a plugged and abandoned well that was drilled through the shale formation. Producing wells from a deeper reservoir, with the formation of interest already cased, provides an even better data source as it allows for perforating and testing in an unplugged wellbore.
The evaluation technique discussed in this article uses geological principles that have been in practice for 50 years for defining sand reservoir producing qualities, but are now being applied to find and grade oil and gas prospects in shales.
Pressure, temperature relation
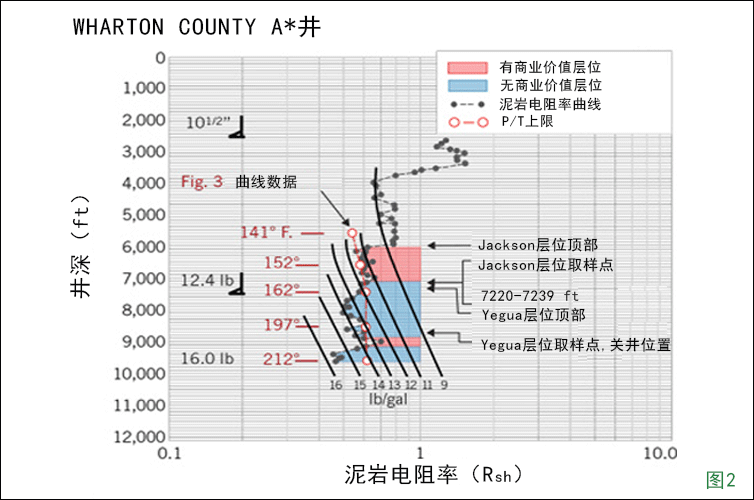
The plot in Fig. 2 primarily serves drilling engineers in determining formation pressures; however, exploration geologists also use these plots to correlate reservoir pressure and temperature (P/T). This method has been especially effective in determining commercial viability on the Gulf Coast’s Plio-Miocene reservoirs. Fig. 3 shows the Gulf Coast P/T relationship which is now being applied to evaluate the Jackson shale.
The P/T relationship is derived entirely from well logs and has been updated through the years with changing oil and gas prices. With few exceptions, the pressure-temperature values from any commercial reservoir will fall within the bell shaped curve in Fig. 3. Any data points falling above the curve at any pressure or temperature level, or falling in the extreme high pressure-extreme high temperature envelope, would indicate a noncommercial hydrocarbon reservoir.
Once temperature data is obtained from the well log, the corresponding maximum mud weight from Fig. 3 can be plotted on the shale-depth relationship of Fig. 2. This plot identifies P/T data points that fall above the bell shape curve (Fig. 3). Any hydrocarbon sands in Fig. 2’s blue area are noncommercial. Shale formations that fall within this P/T environment will not produce commercial volumes of hydrocarbons.
This relationship has been used in the past only for defining sand reservoir producing qualities. This study takes the concept a step further by applying these principles directly to shale formations to determine production potential.
To date, Jackson shale data are limited due to low interest from operators, and the formation remains untested on a large scale. Existing data is encouraging.
Wharton County test
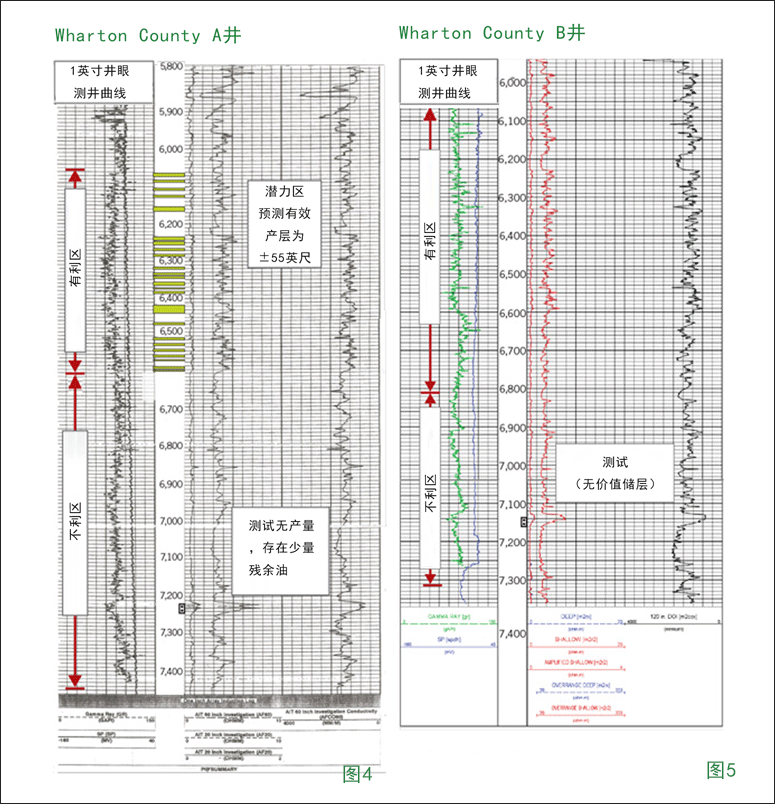
The procedure to determine the commercial nature of the Jackson shale requires a well log to make a shale resistivity vs. depth plot (Fig. 2). The plot came from a well in Wharton County (Fig. 4) in an area where oil and gas is produced from multiple sands in both the Frio and Yegua formations. The Texas Railroad Commission (TRC) lists this well as a shut-in gas well from a deeper gas sand. If the Jackson shale proved to be prospective from this analysis, it would be a good candidate for testing. The tops of the Jackson and Yegua formation are 5,930 ft and 7,400 ft, respectively.
The transitional top of the abnormal pressure in this well is at the top of the Jackson shale at 5,900 ft (Fig. 2) and from this depth to 7,000 ft this 1,100-ft interval of the Jackson falls within the commercial envelope shown in Fig. 3. This interval also has a moderate pore pressure of 11.5 lb/gal mud-weight equivalent. The slight overpressure is indicative of the presence of hydrocarbons and this pore pressure could be a factor in the producing mechanism of the reservoir.
From 7,000-8,800 ft, which is into the Yegua shale interval, pressure values fall above the P/T cut-off curve (blue color interval, Fig. 2). This deeper interval would be in a noncommercial environment. A basal Jackson sand was perforated at 7,220-7,239 ft within this noncommercial environment and tested a small volume of oil but was never produced. Oil found in this environment is usually residual and when present will be noncommercial.
Another parameter that must be satisfied in this approach is determining the presence of silty or limy sand stringers within the favorable shale section. An SP or gamma log can aid in this determination. These stringers are the reservoir rocks within the shale. The pure, fine-grained shale above and below these interbedded stringers are too impermeable to produce and can be considered the source rock for these thin reservoirs. Density or sonic logs are helpful in identifying values for porosity and saturation and can indicate whether the zones are oil or gas saturated.
Fig. 4 is the induction-resistivity log over the Jackson section of interest, from which the shale data were obtained to make the shale plot in Fig. 2. The SP curve apparently malfunctioned and is unusable, but the gamma log is a good substitute. The 6,060-6,600-ft portion of the Jackson lies in a favorable environment: a possible 55-ft of hydrocarbon pay is present in silty sand and limy stringers. These stringers are the reservoirs and contain the inherent permeability paths for the hydrocarbons to flow through the Jackson into the well bore.
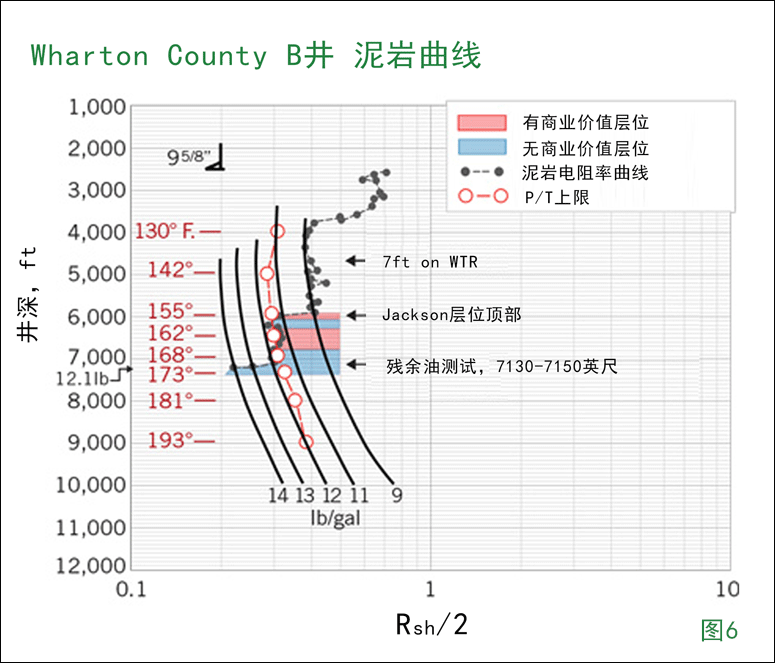
The question becomes how to best stimulate these thin, low-porosity and low-permeability stringers within the 500-ft interval. Properly stimulated, a conservative number for recovery based on 40 acre drainage and 30 ft of pay would be about 95,000 bbl of oil or 500,000 Mcf of gas (with porosity at 15% and water saturation at 50%), well within commercial values. Fig. 5 is the log section from a well recently drilled near Wharton County Well B. A prospective Jackson sand at 7,130-7,150 ft correlates to the tested Jackson sand at 7,220-7,239 ft (Fig. 4). The sand was perforated and tested with unsatisfactory results. In Fig. 6, the shale plot from the Wharton County Well B shows that the sand is in the unfavorable geological P/T environment. The favorable environment for the Jackson section is above 6,800 ft.
Jackson shale producers
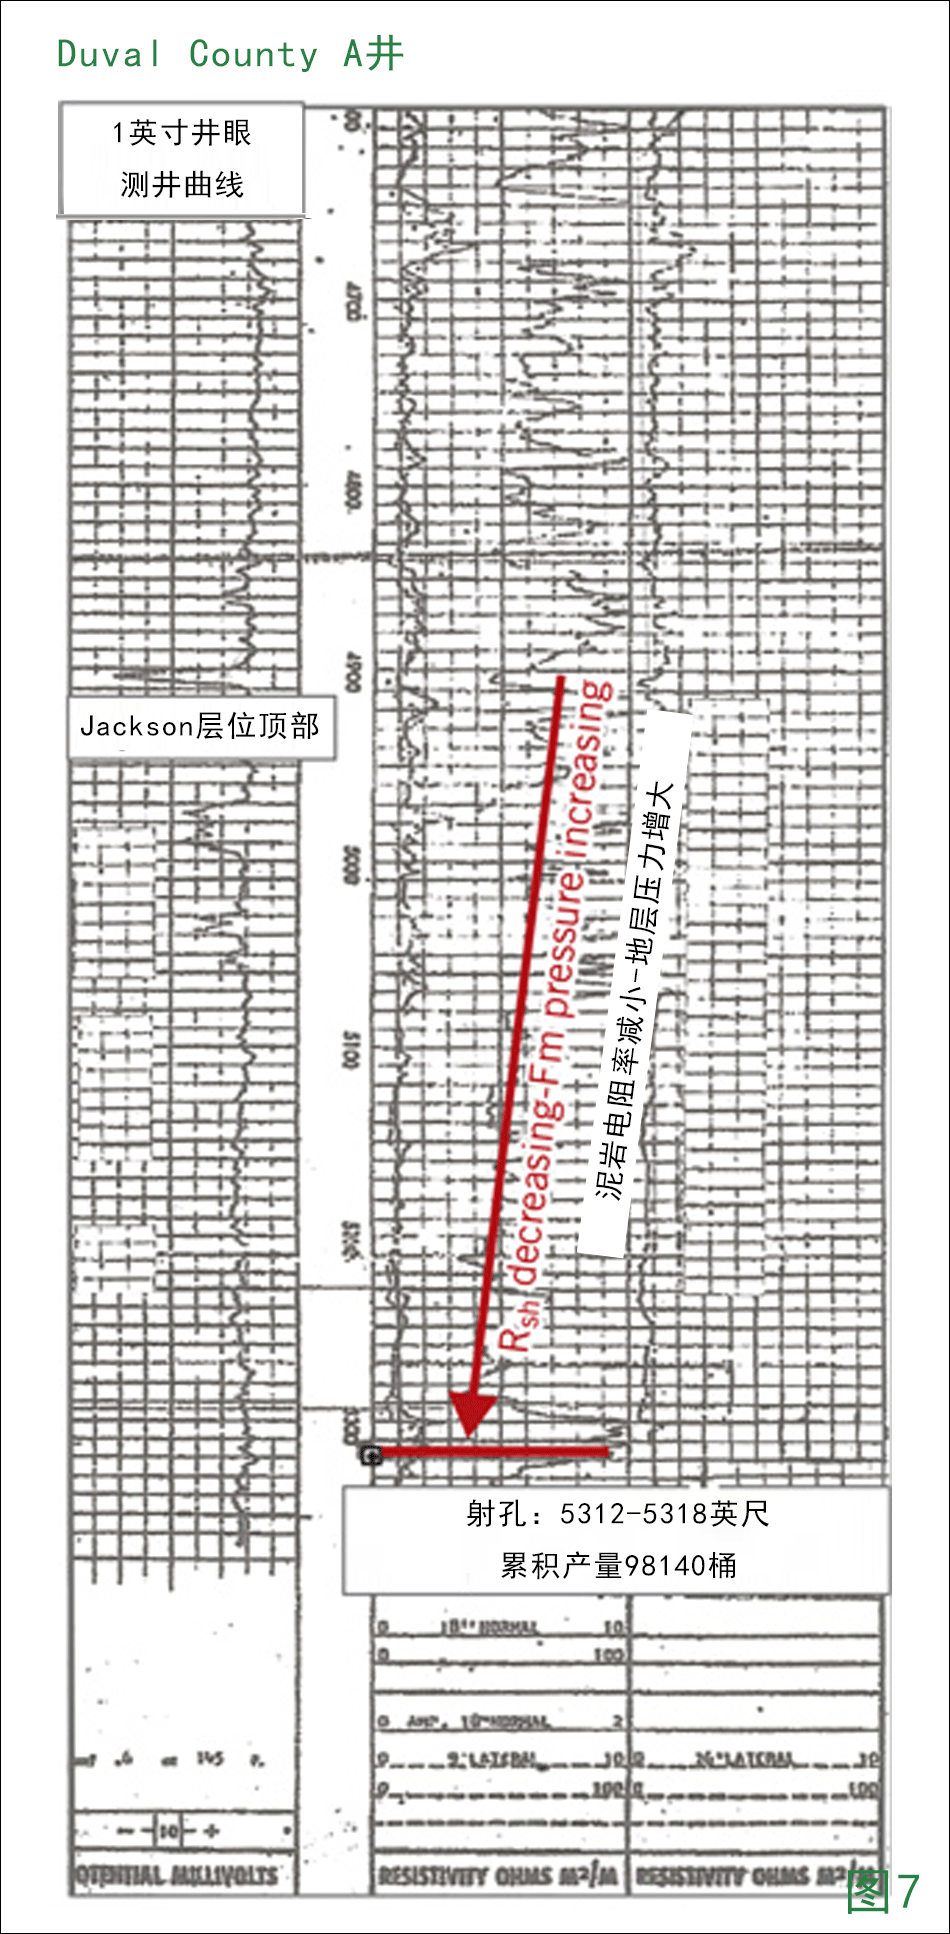
Fig. 7 is the log section from Well A in Duval County, Tex., that shows the upper Jackson shale interval with its top at 4,950 ft. Note the decreasing shale resistivity from this depth to the total depth at 5,360 ft, indicating that formation pore pressure is increasing with depth through this interval.
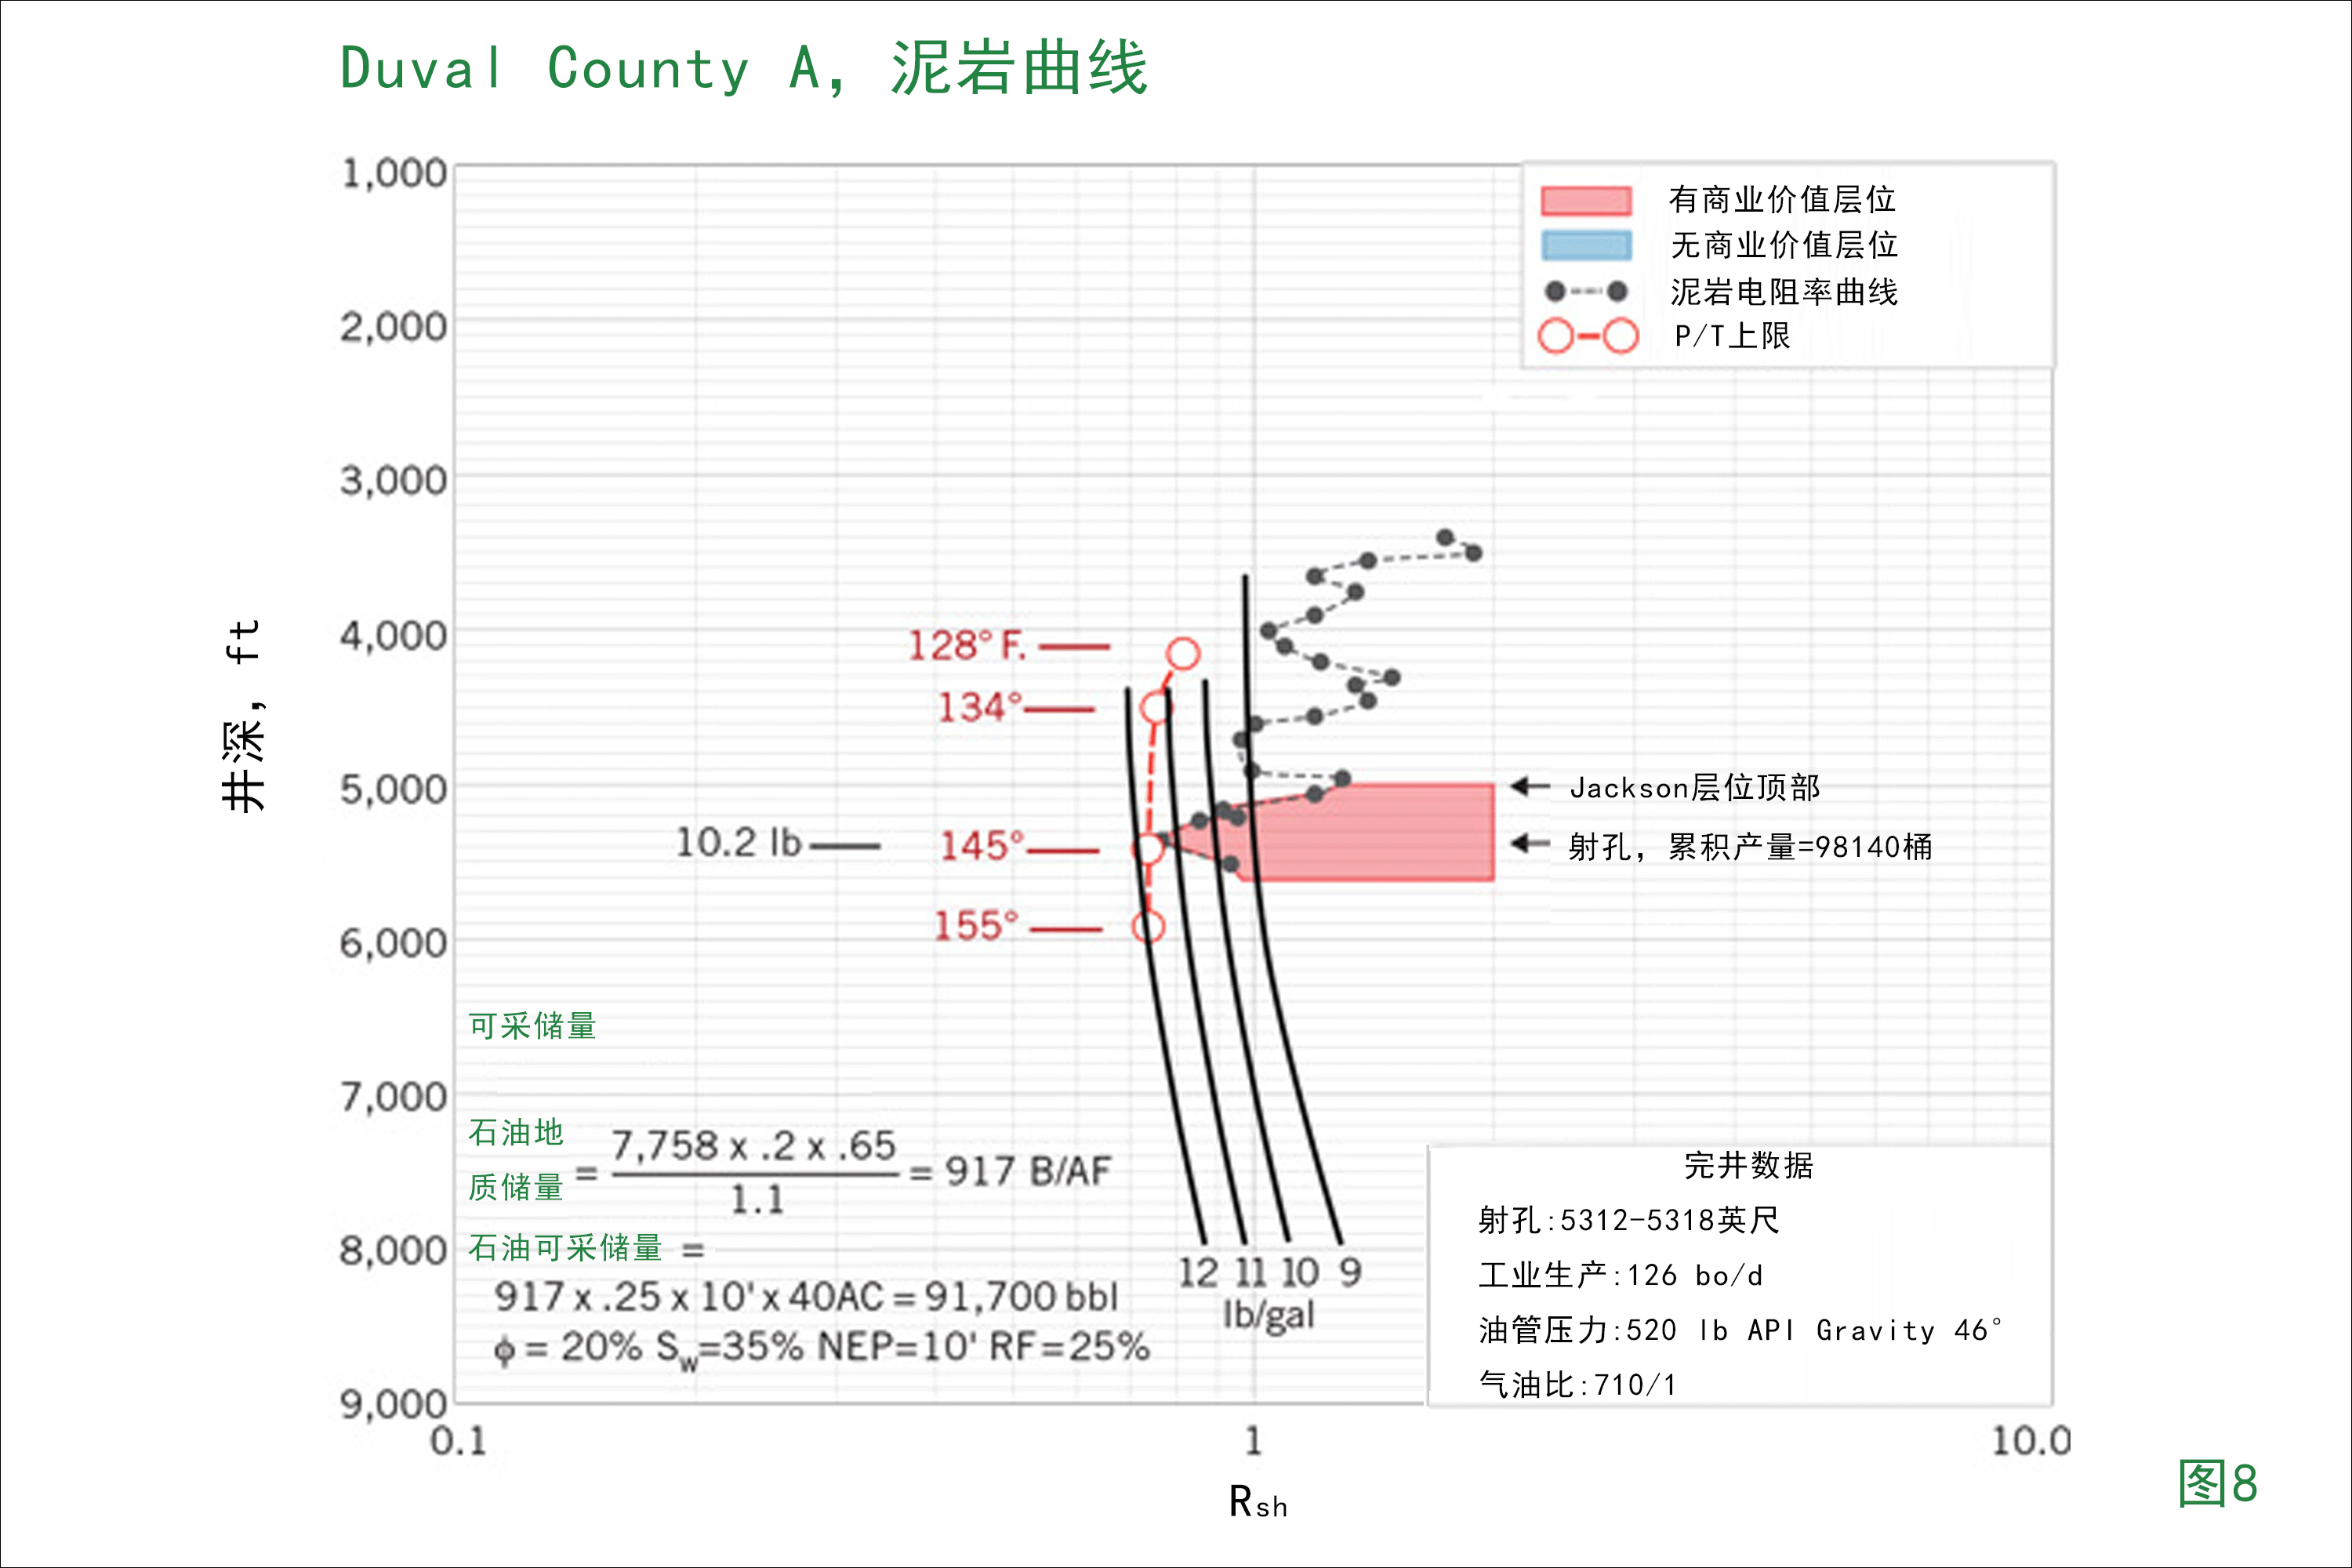
The shale resistivity-depth plot is shown with the P/T curve overlain (Fig. 8). Shale resistivity points fall below the P/T curve, indicating the entire section is in a favorable commercial window which includes a 30-ft silty shale interval at 5,300 ft. The lack of an SP might be a negative factor for this prospect as permeability could be low. This well, however, meets all the parameters for a potentially productive and commercial Jackson well. The well was perforated in the silty shale zone at 5,312-5,318 ft and flowed 126 b/d of oil on a 10?64-in. choke at 525 psi during initial tests. Cumulative oil production for this well was 98,140 bbl.
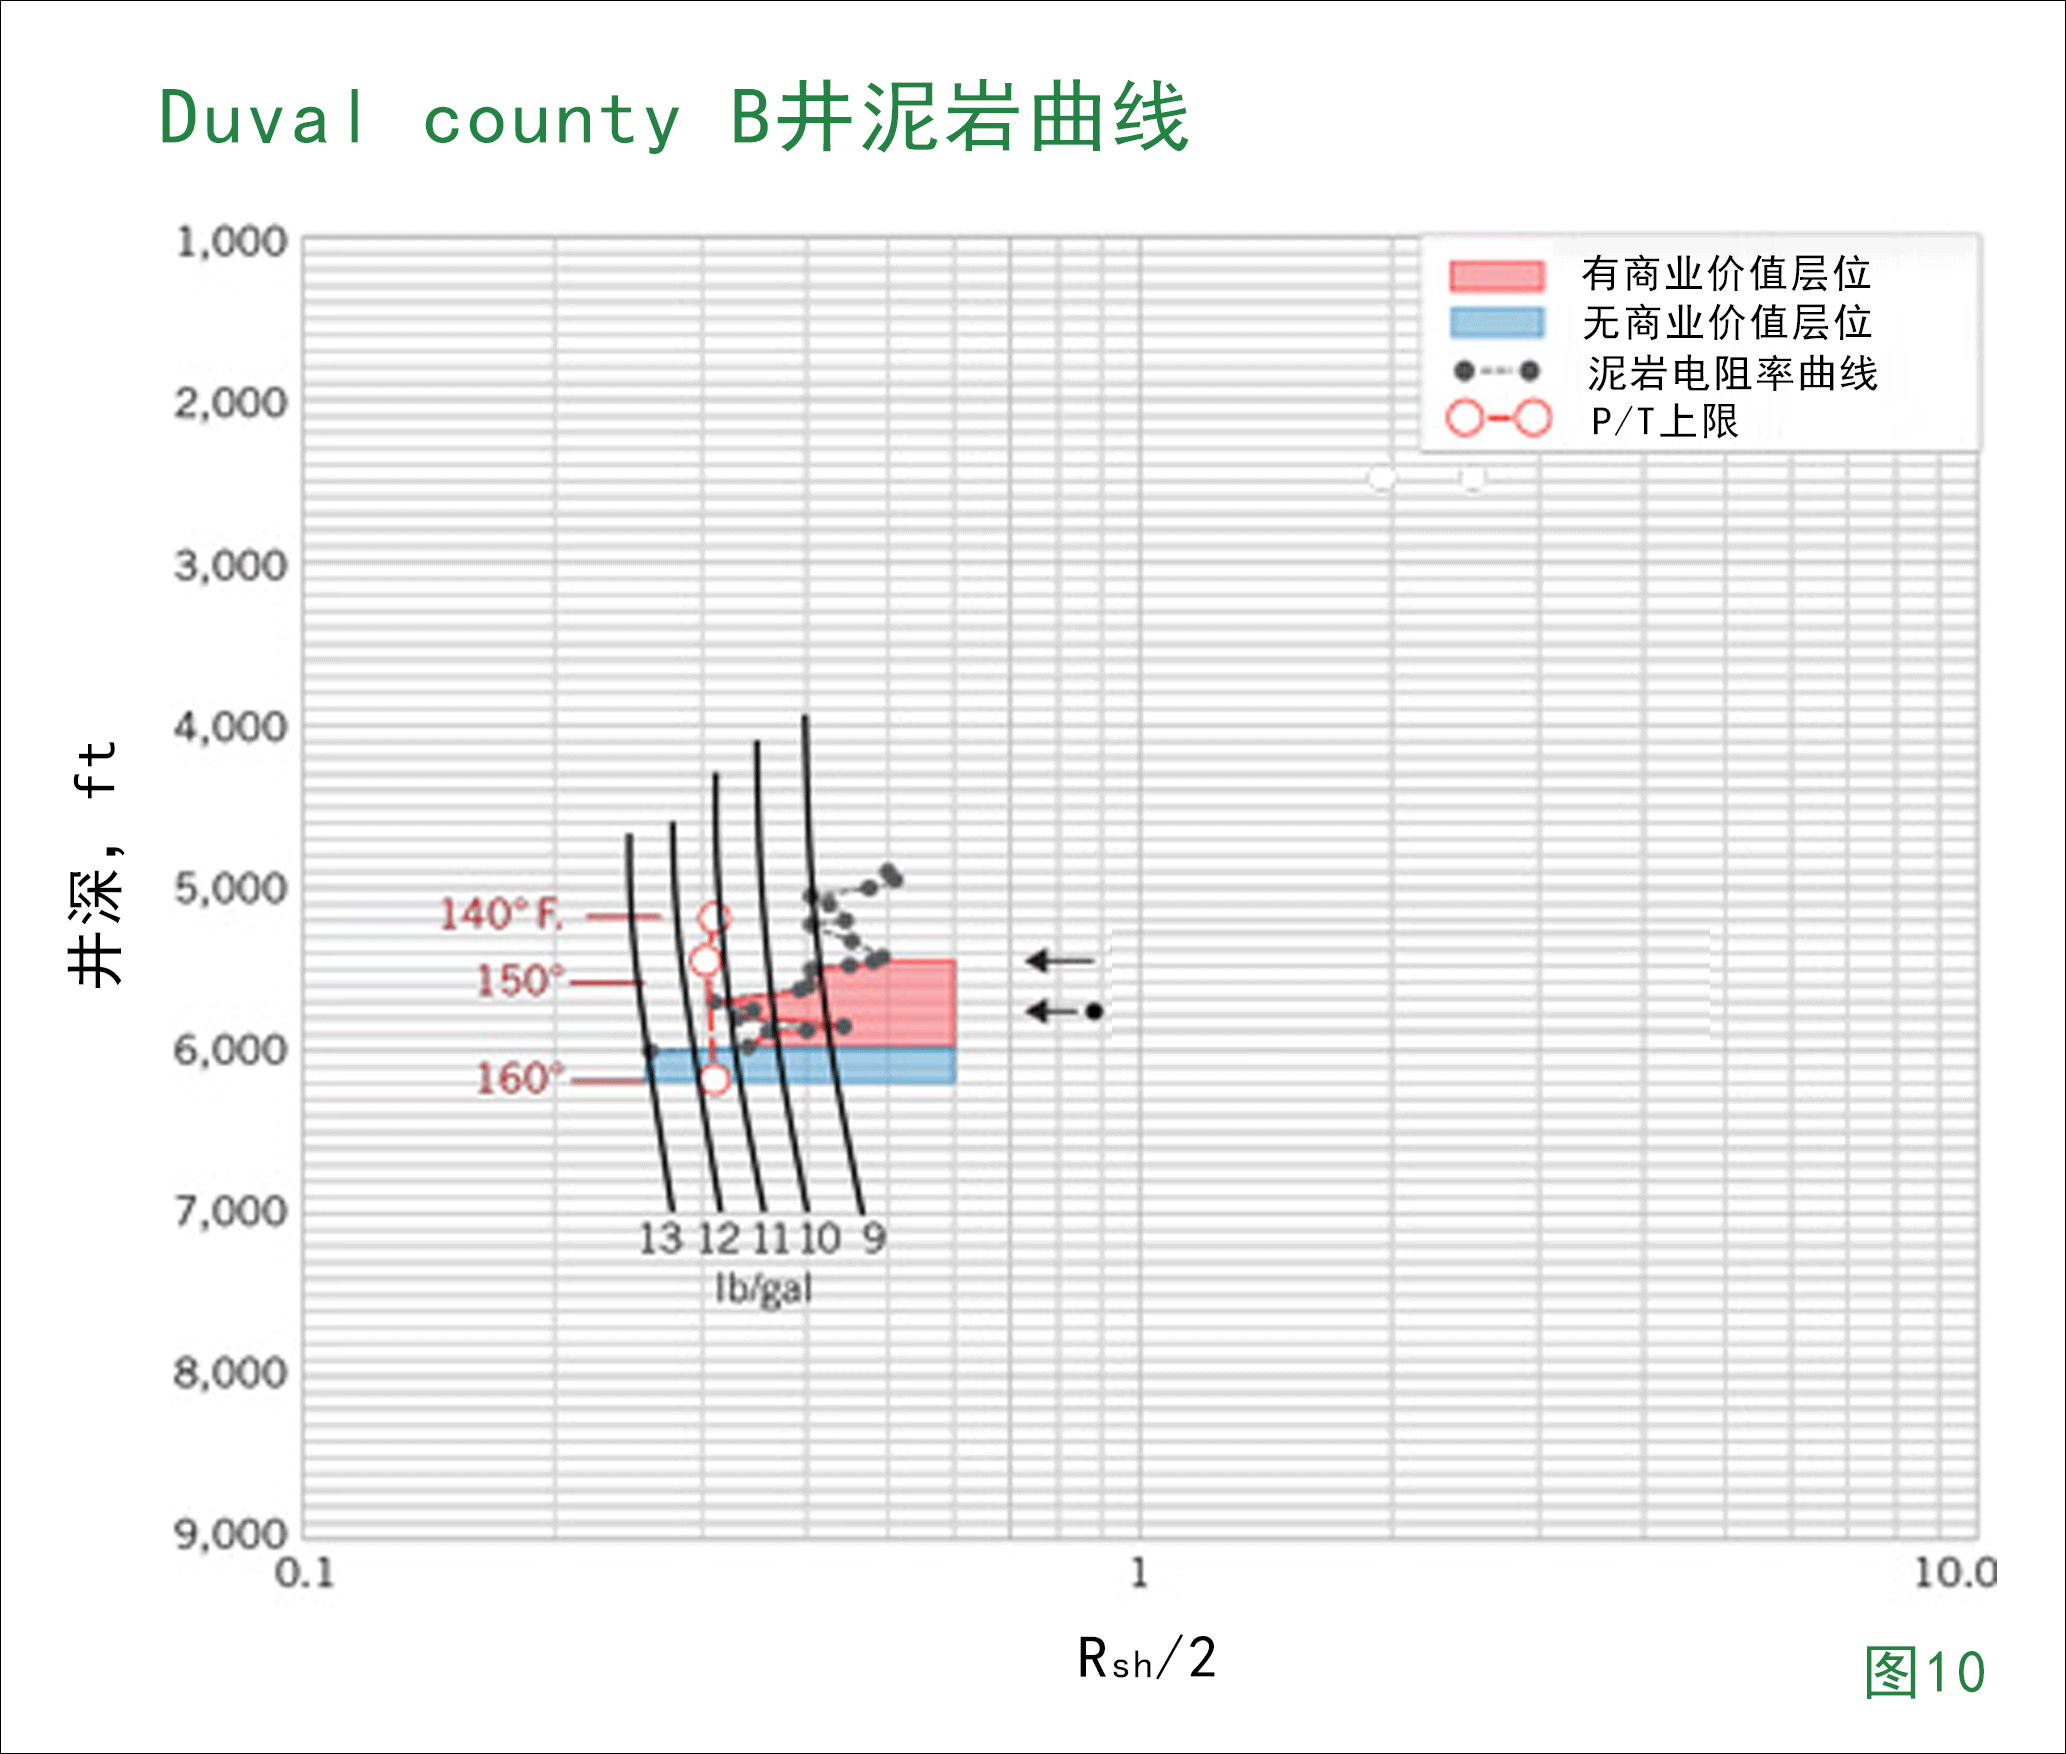
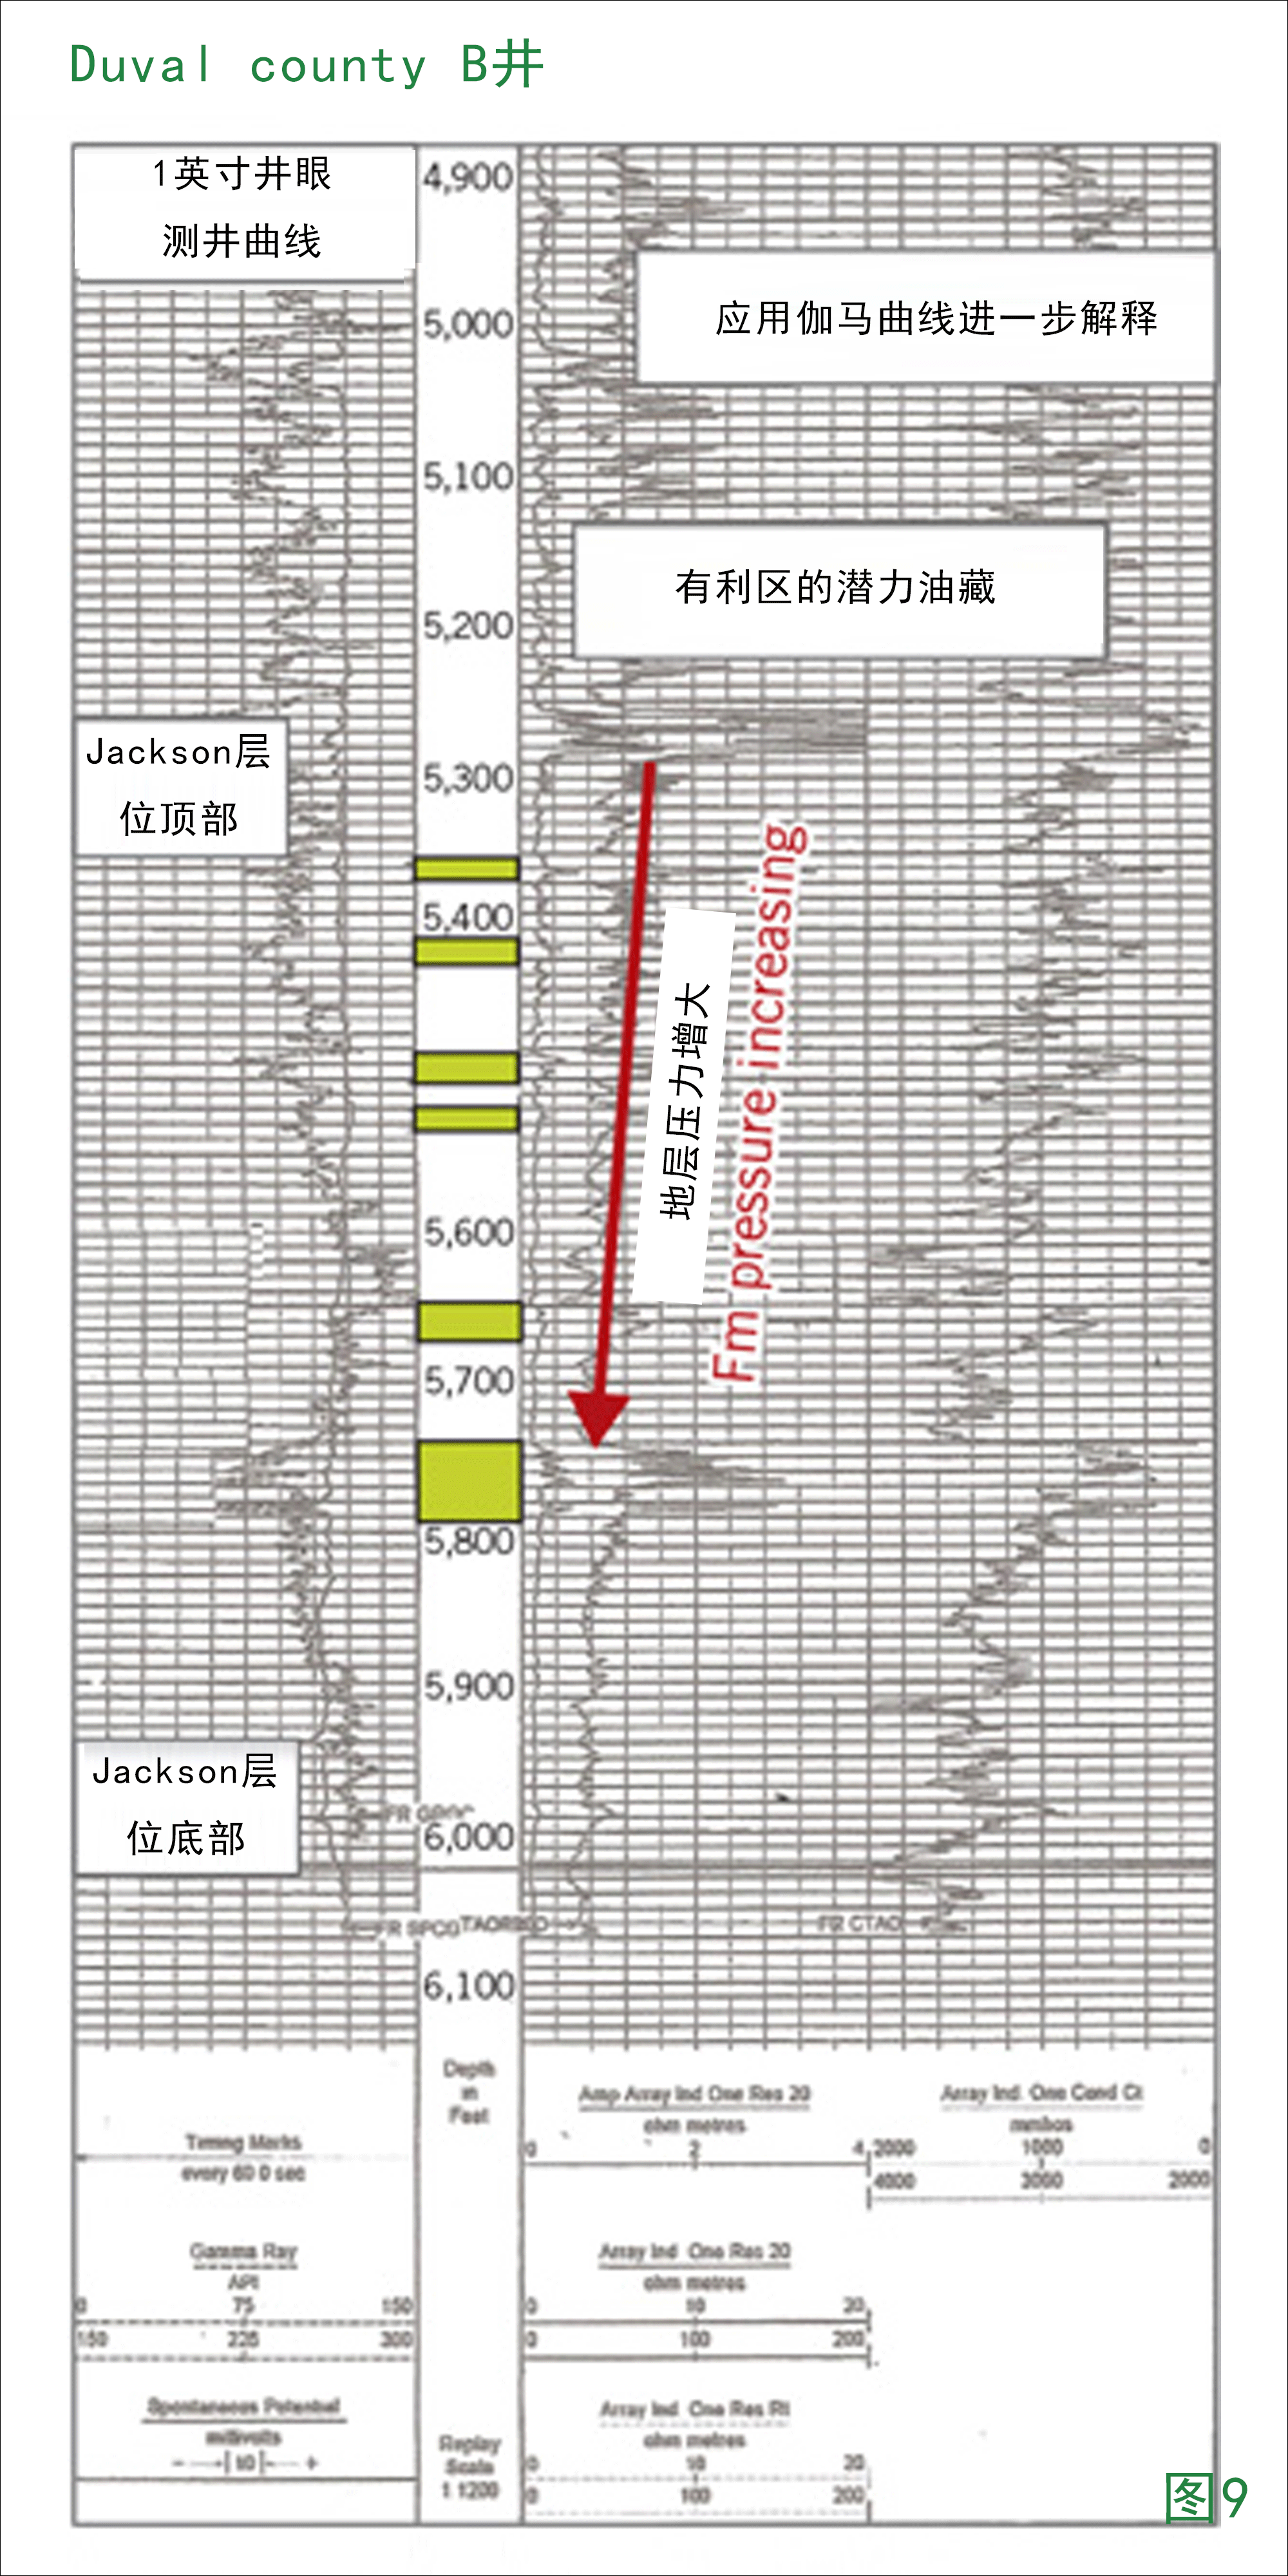
Duvall County Well B (Fig. 9) looks similar to the log for Well A (Fig. 7). The shale plots for both Duvall County wells also bare similarities (Figs. 8 and 10).
Adding a gamma ray run in the well enhances the interpretation of the log in Fig. 9. When comparing this gamma ray with the SP, the silty-sand zones stand out more prominently. This could also imply that the prospective zones have poor silt-shale interbedding, which would decrease the SP. But the prospective zones still could have some permeability even with inherently silty and fine-grained lithologies. In most of these potential Jackson wells, however, fracture stimulation will have to be considered.
Speculative potential
There is limited information on the producing potential of the Jackson shale, and what data does exist is somewhat negative. One method of proving commercial production from Jackson would be to select a low-cost venture that satisfies the technical approach outlined in this article. This could be a well that is already cased through the Jackson section or a new well keyed off a dry hole with well logs indicating probable shallower overlooked pays in the Frio section above the Jackson. As an example, this article uses the latter case.
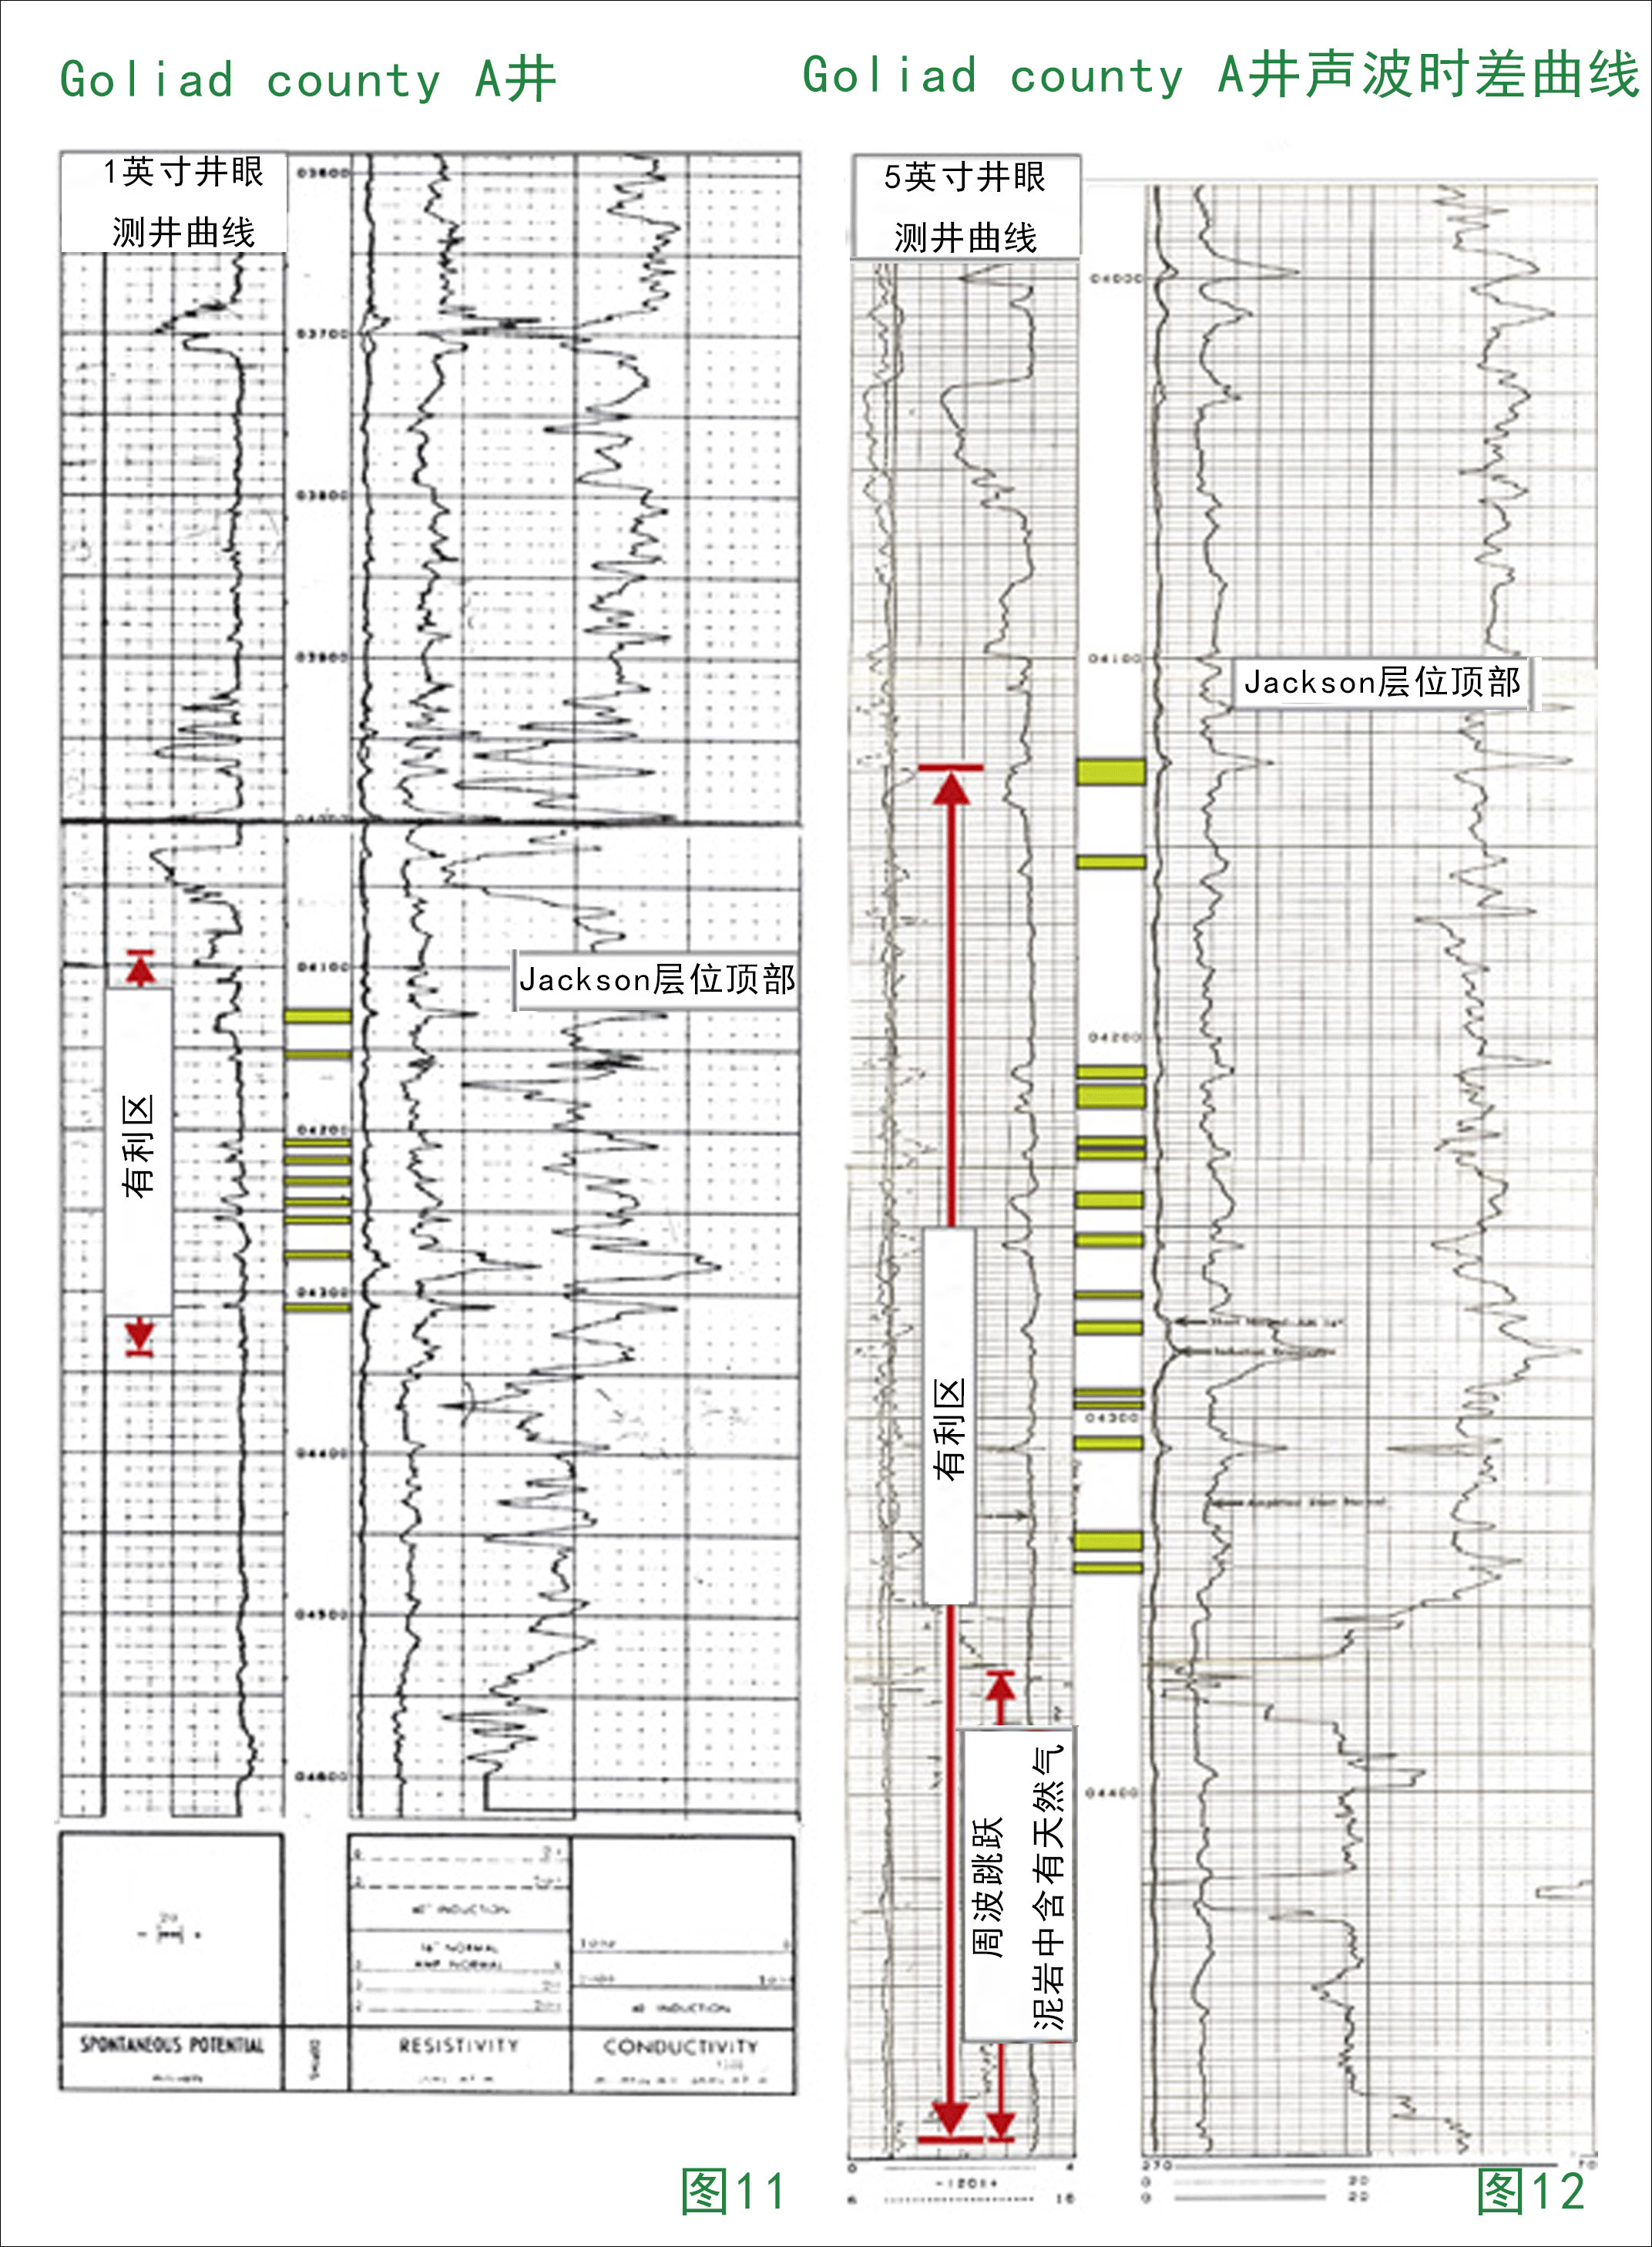
Figs. 11 and 12 are the 1-in. log and the 5-in. log (including a sonic log) from a dry hole drilled in Goliad County, Tex., in the 1970s. The operator took a gas kick after logging and could not run casing because of hole conditions, and the well was abandoned. The well logs indicate potentially three gas pays up-hole in the shallow Frio. This includes confirmation from a density-neutron log. There are probable thin oil or gas zones in the Jackson at 4,306-4,310 ft, picked up by the resistivity log and the sonic-log cycle skipping. These zones would likely produce naturally.
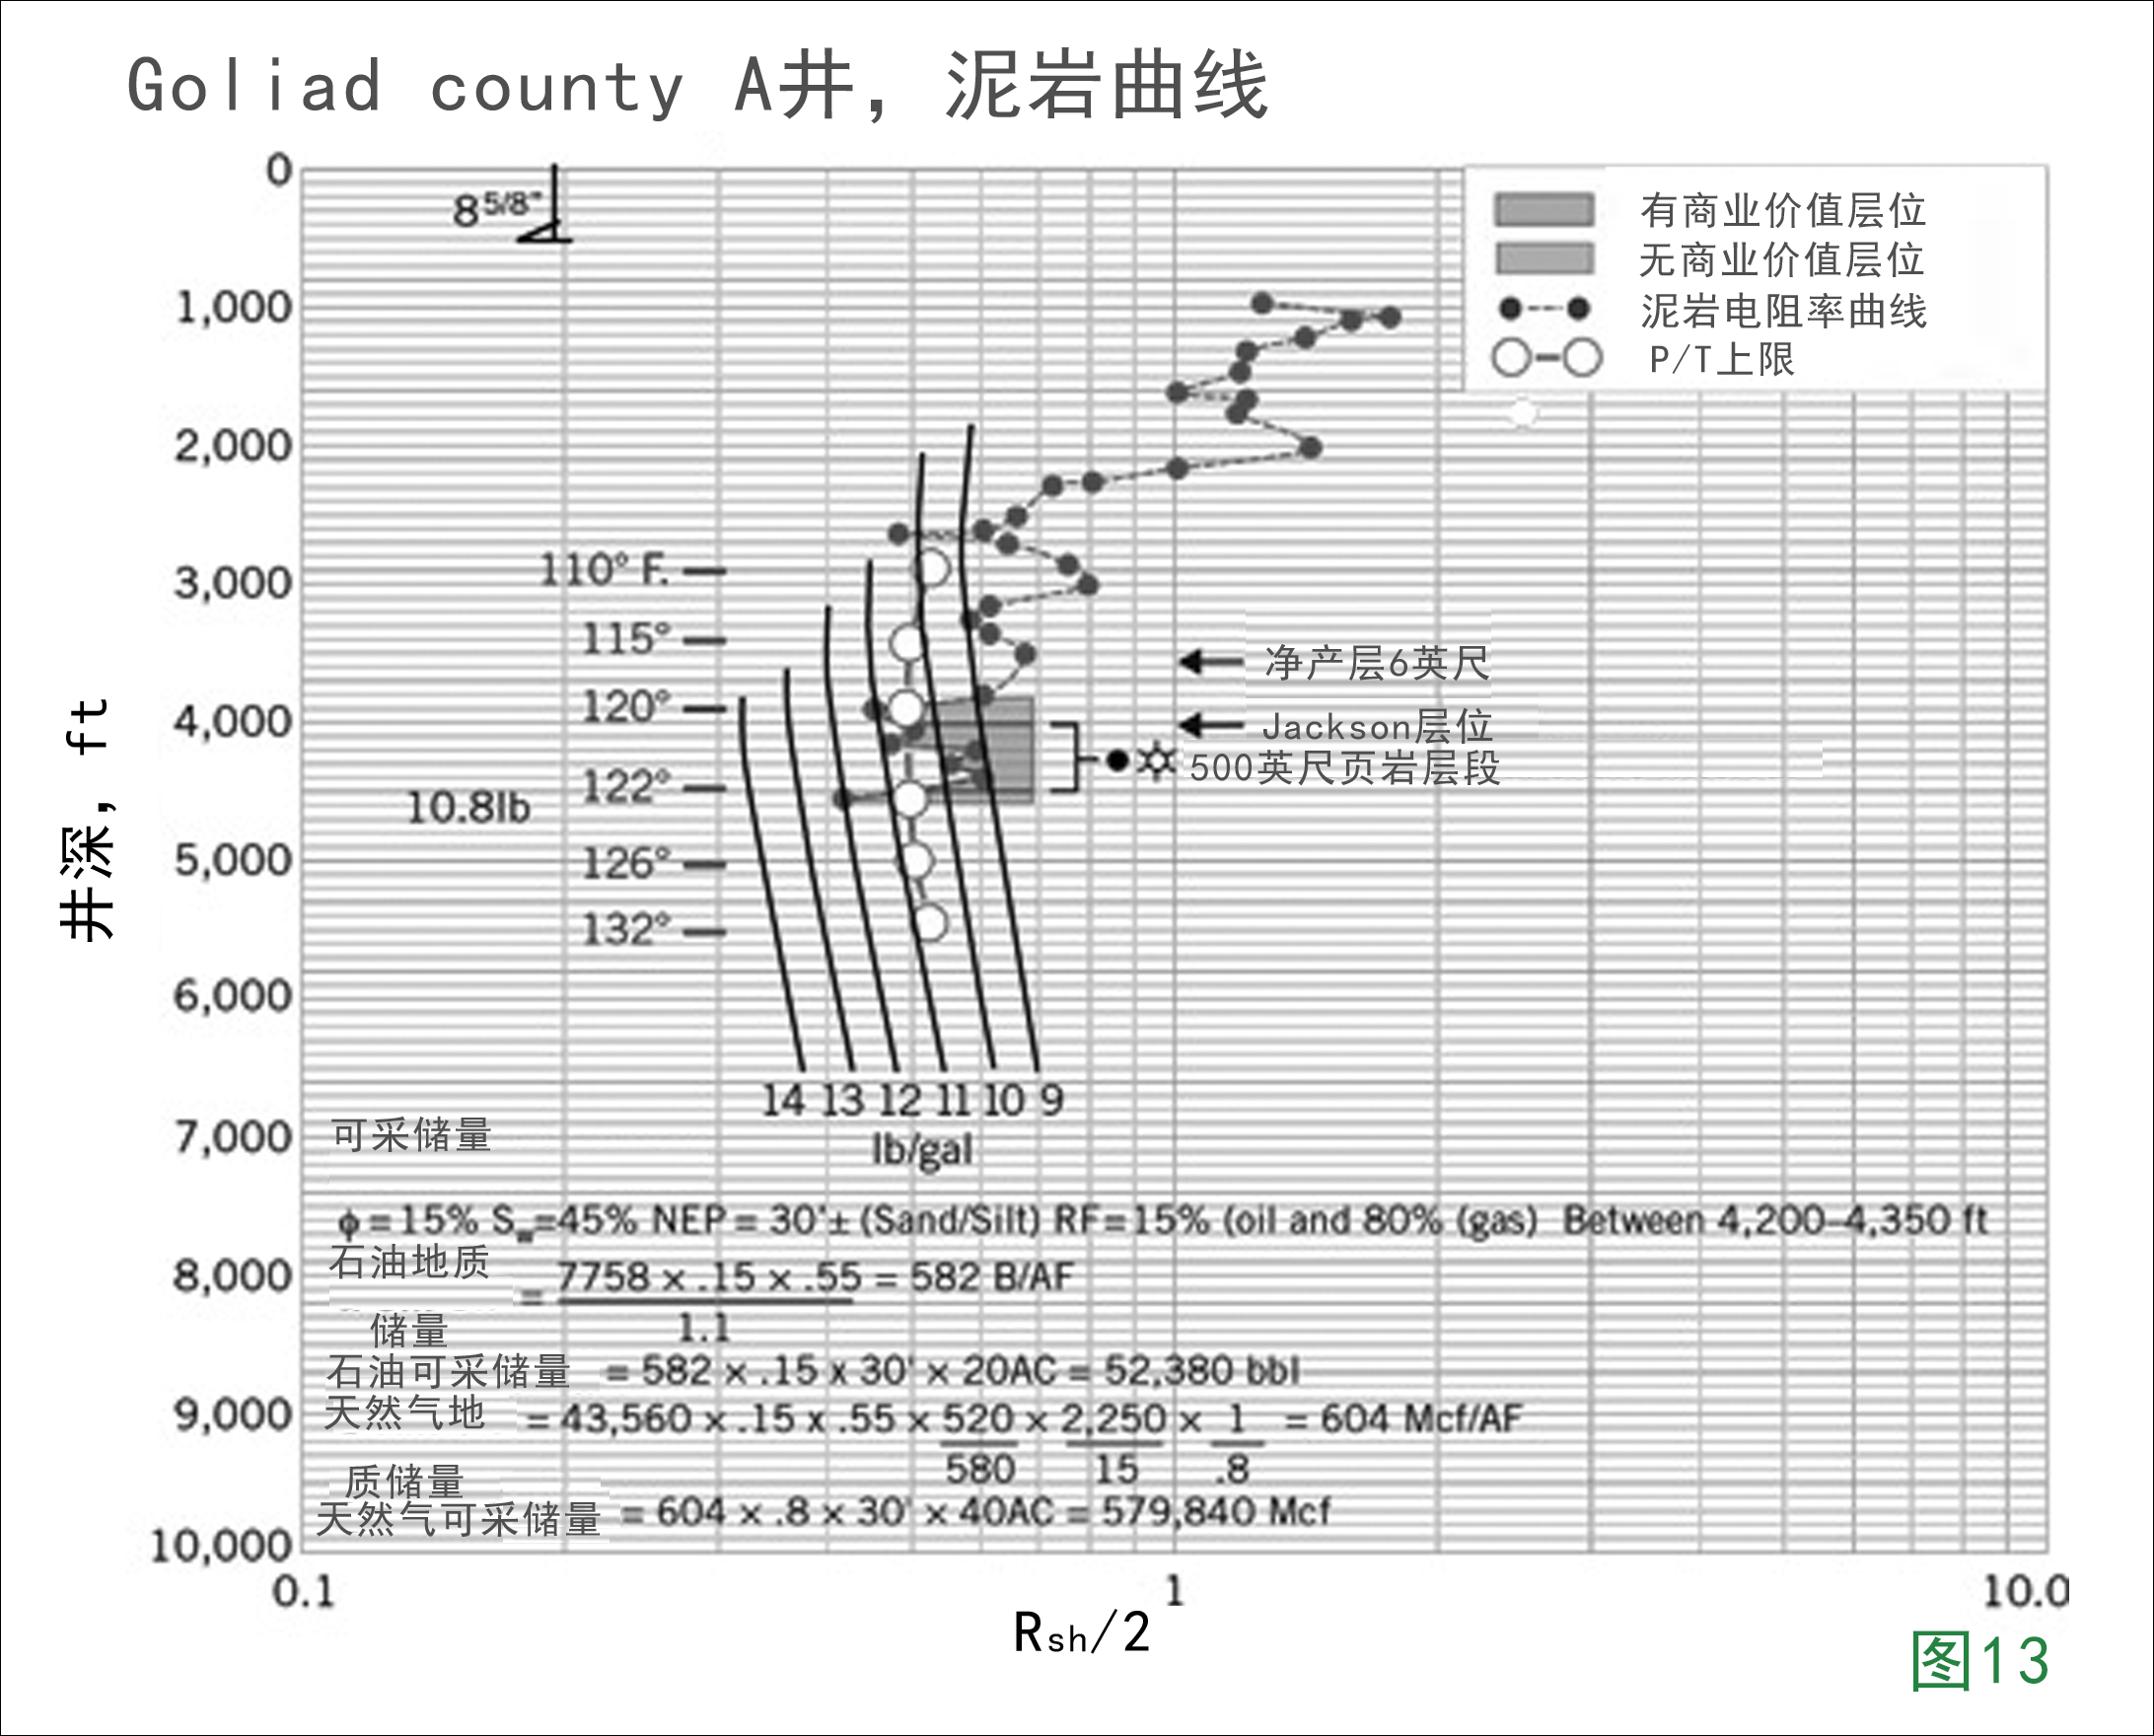
The 5-in. log shows gas-cut mud present below 4,355 ft as also indicated by the sonic-log cycle skipping. Evidence is available throughout the Jackson section confirming the presence of hydrocarbons. The shale plot shows a favorable commercial environment extending 500-ft at 4,100-4,600 ft. The SP and resistivity log along with the sonic log show the most promising Jackson interval is 4,200-4,355 ft. This 155-ft interval is estimated to contain 30-ft of net hydrocarbon pay. Estimated recovery is 52,380 bbl of oil or 579,840 Mcf of gas (Fig. 13).
Fracture stimulation would be difficult in this zone as it would be hard to stimulate 2-4 ft stringers in a gross 155-ft section, but a satisfactory solution would provide a good opportunity for an operator not currently working in an established shale play.
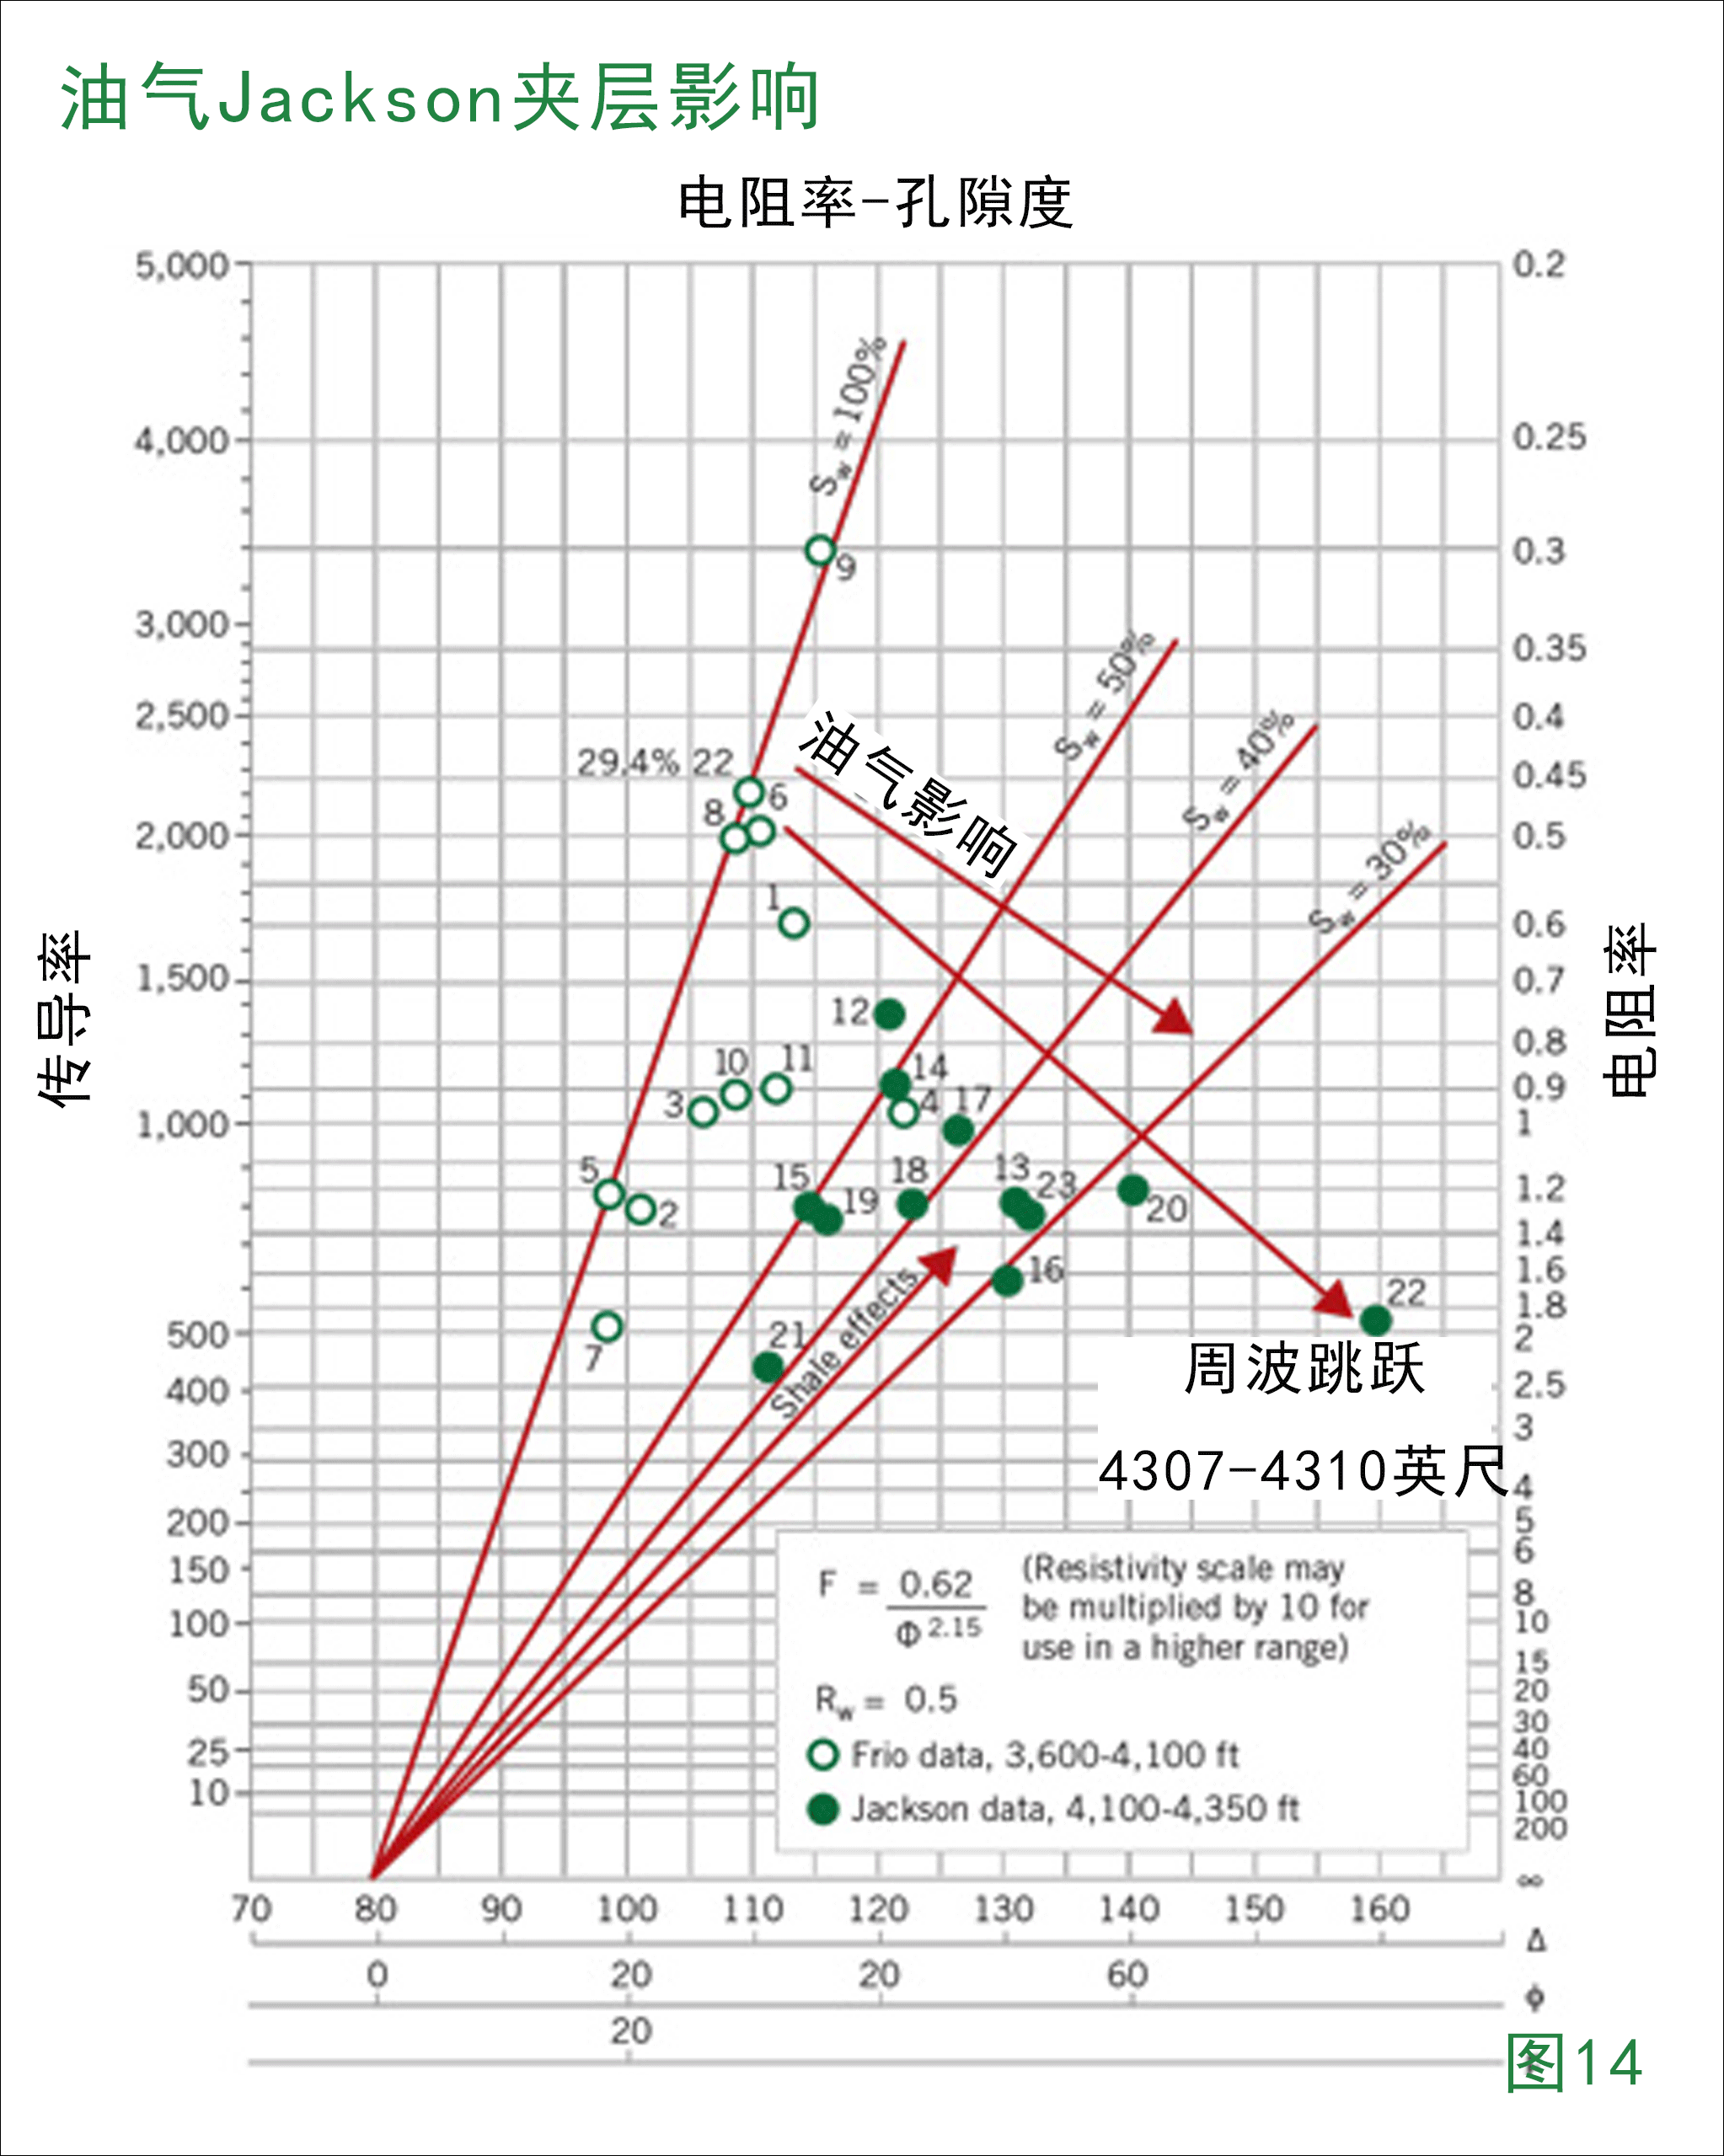
Fig. 14 is the cross plot of sonic travel time and induction resistivity for the discussed Goliad County well, which includes a portion of the Frio section and the upper portion of the Jackson to 3,450 ft. The black dots are Jackson points and tend to fall in the range of 45% water saturation, providing a rough estimate of saturation in the silty-sand stringers.
Formation pressures and temperatures derived from well logs provide the basis for the evaluation method presented in this article. Proof of the value of this method will be in the success or failure of future wells or tests behind the pipe of existing wells. The method provides new, low-cost means of developing viable drilling prospects in lesser known plays.

 石油圈
石油圈