Pad D – Results and Improvements
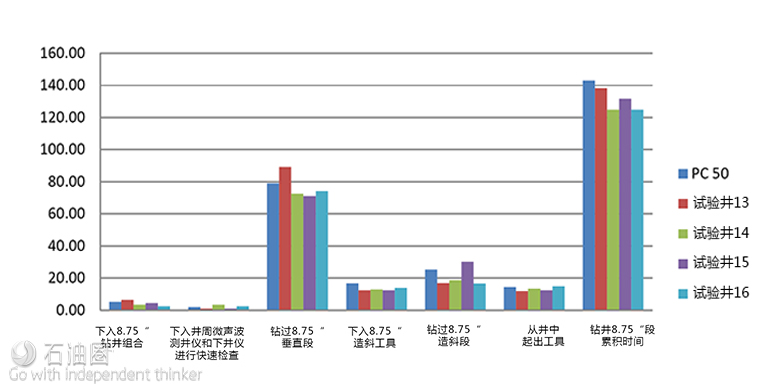
Pad D had four wells, three holding a 10° tangent and one holding an 8° tangent to KOP. The main objective evaluated in the upper vertical interval was to test the different BHA stabilization recommendations to determine which mitigated the dropping tendency the best with the least amount of sliding. The reduced bend curve assembly was run in all of the curve intervals and reduced observed downhole vibration compared to previous pads. Fig. 20 shows the four wells with their cycle times for each of the measured operations.
● Well 13: Drilled the first part of the vertical interval with eight stands of HWDP. Drilled with a spiral string stabilizer placed behind a stabilized motor. This method saved 5 hours versus the field average.
● Well 14: Used a BHA with a rotating near bit stabilizer, stabilized motor, and eight stands of HWDP. Saved 18 hours compared to the area average.
● Well 15: Used a slick BHA with a larger diameter bearing housing stabilizer on the motor for the first BHA run. Used eight stands of HWDP. A second curve run was required with a 2.38° motor after the first run was pulled for BUR. Saved 11 hours compared to the area average.
● Well 16: Used the first BHA from Well 14, but with the motor stabilizer removed to improve WOB transfer. Overall, saved 18 hours compared to the field average.
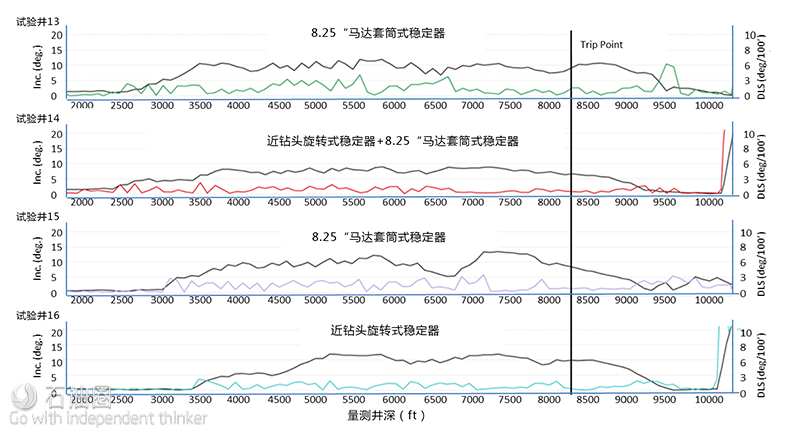
The four different BHA configurations tested in the top part of the vertical interval had varying effects on the directional dropping tendency. Wells 14 and 16 used a near-bit stabilizer which reduced the number of slides needed to hold the tangent and were noticeably less erratic in dog leg severity (DLS) over the interval. Fig. 21 shows the inclination and DLS from each of the wells.
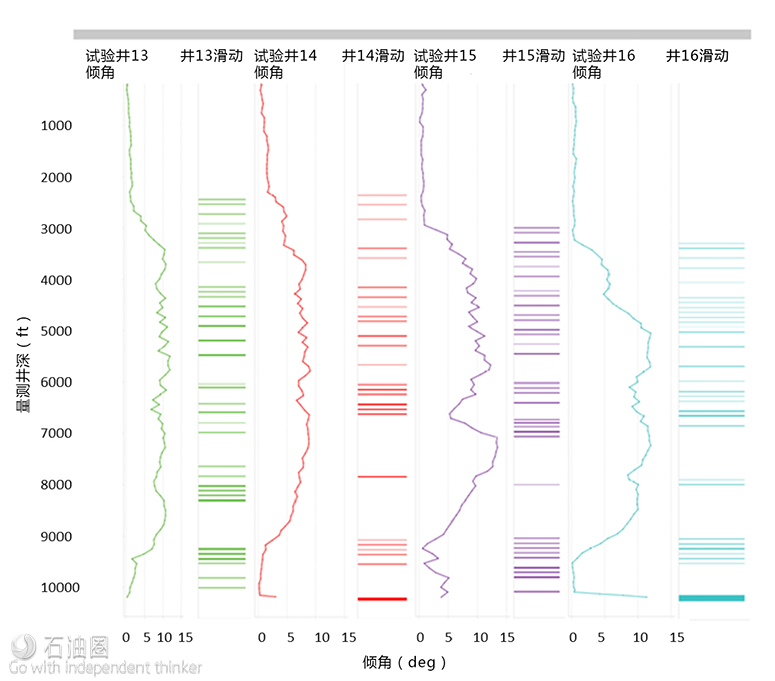
Wells 14 and 16, drilled with the near bit stabilizer, had DLS below 3°. Fig. 22 shows the sliding operations associated with maintaining the target inclination. Well 14 required the least amount of slides at 27 and a total footage of only 472 ft,to complete the section. This was an improvement of almost 50% in sliding footage compared to the previous well which required a total of 35 slides with a total sliding footage of 918 ft.
The rig crew observed tool face control issues from the stabilizer on the motor while sliding when WOB transfer was impeded. Even so, this resulted in the well drilling the fastest vertical interval to KOP on the pad and was in the top 7% of all wells drilled in the area with a tangent section over 8°.
Well 15 matched the time spent sliding on the Well 14, but the sliding footage increased by 381 ft and required 37 total slides to complete the tangent section with higher DLS observed throughout the section. Well 16 decreased sliding footage compared to Well 15 by 206 ft and the average rotating ROP was the fastest on the pad. Holding the desired tangent angle required 32 total slides and showed a decrease in erratic torque and vibrations seen throughout the section.
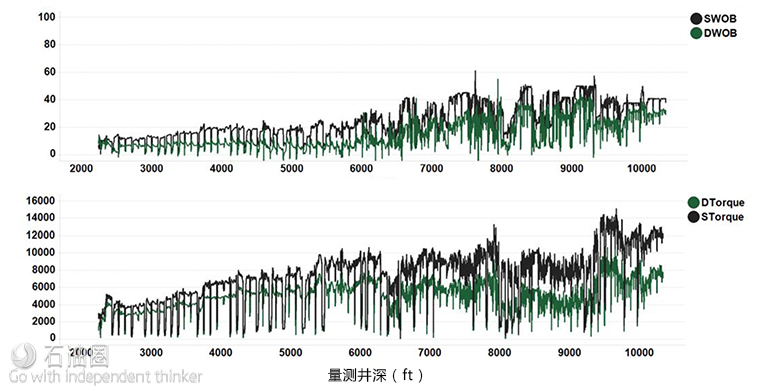
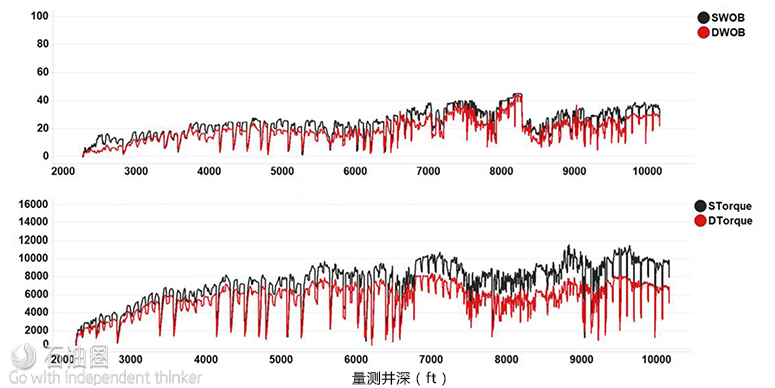
Surface and downhole WOB and torque on bit (TOB) measurements were compared to quantify how much energy was lost in torque and drag between wells with reduced DLS and higher DLS. For example, Fig. 23 and Fig. 24 compare Wells 13 and 14. The separation between surface and downhole WOB and TOB is higher for Well 13. While tripping out of the hole on Well 14, the rig experienced two different tight-hole events after drilling the section associated with the near bit rotating stabilizer. The first event occurred while tripping through one of the salt sections and the second when re-entering the casing shoe.
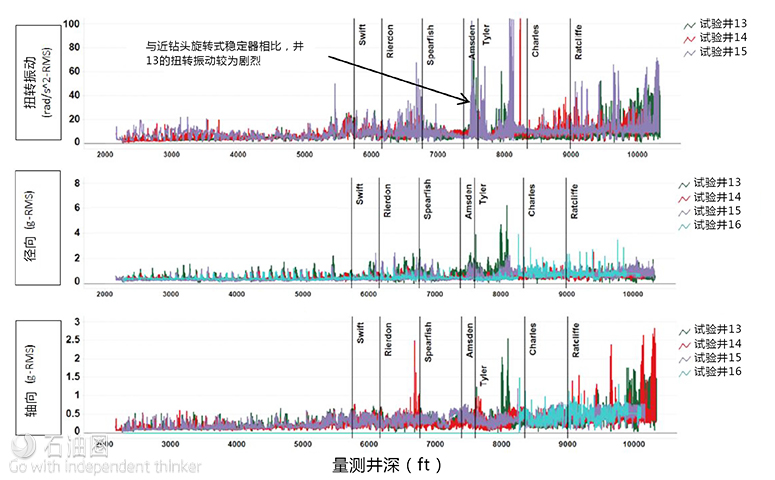
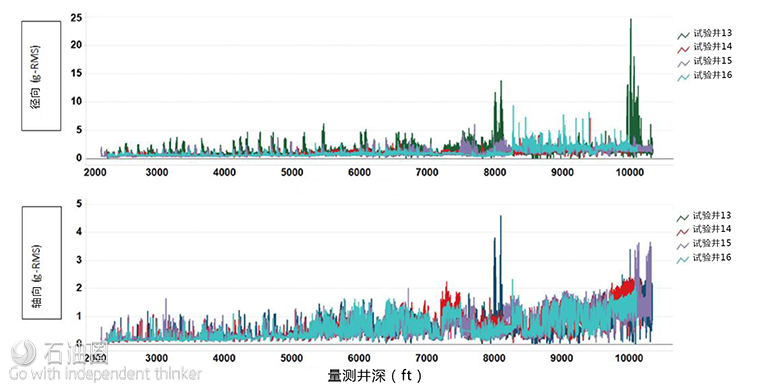
Reduced vibration was also observed from sensors at the bit and the BHA measurement sub for the runs with the near bit rotating stabilizer as shown in Fig. 25 and Fig. 26.
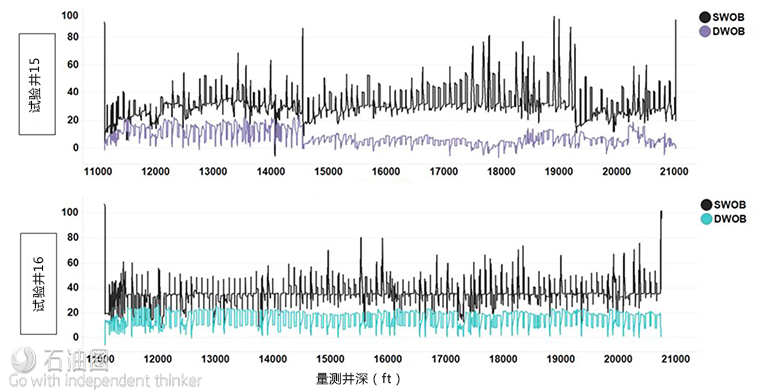
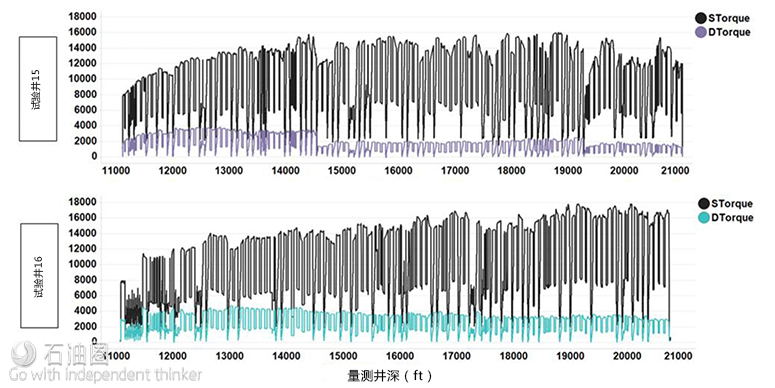
Measurement tools were run in memory mode in the lateral BHA to investigate whether the reduction in DLS in the vertical interval would translate to a benefit in torque and drag. The surface and downhole WOB in Wells 15 and 16 are compared in Fig. 27. Torque is compared in Fig. 28. The main observable difference was the surface WOB required for sliding, which appears to be slightly lower and more consistent in the well with lower DLS. It should be noted the two laterals are placed in two different formations. It is unknown what effect this had on torque and drag.
Project Summary
The rig on which the project was conducted had not delivered a well in the top quartile of the fleet in over two years. Over the course of the four pads drilled during the project, the vertical and curve sections of the well were drilled in the top 18% of fleet on average. Comparing 2014 and 2015 performance, this rig improved 24% in terms of footage per day in the vertical interval compared to the rig fleet which improved17% over the same period. The project rig was second best compared to the individual year-on-year improvement of the other rigs. Fig. 29 demonstrates the performance attained by the end of the project with a plot of on-bottom drilling time versus depth. The last pad shows the consistency between wells after applying the learnings and practices developed during the project.
To quantify the financial success of the project, the operator calculated a breakeven point by comparing the well times to the average well times. The footage for all well times was normalized. The target overall time for the 8 ¾ in. interval decreased by 20% because of changing the benchmark from Pads A and B to Pads C and D.
Expected Cost (Average Target Interval Time x Spread Rate) – Actual Cost – DHAS Cost = Savings
On the four pads with 16 wells, six target intervals achieved breakeven costs and six missed break even by less than $100,000. The remaining four wells missed breakeven due to trouble time in the curve and the additional drilling time incurred experimenting with vertical BHAs in tangents over 4°. This caused the overall project to miss breaking even. However, the lessons learned for the rig fleet easily justify the project cost.
Conclusions
●A number of areas of the project have value:
The real-time information provided from downhole measurements improved the driller’s and drilling team’s awareness of drilling efficiency.
The analysis of the downhole measurements post-well helped find and frame drilling problems.
The stick/slip mitigation system effectively reduced stick/slip and improved the function of the control systems.
The DHAS shows promise and needs further improvement to simultaneously manage or mitigate more of the downhole drilling issues.
●Causes of problem time other than the DHAS had a negative effect on project economics:
Trips in curve for motor failures or insufficient BUR
Remedial work necessitated by casing stuck off bottom
Extra drilling time because of unsuccessful experiments (i.e., string stabilizers + drill collar)
●There are key ROP limiters in the vertical and the curve:
Directional dropping tendency in the top half of the vertical interval
Bit damage from vibration from stick/slip and on/off-bottom practices
Extra runs in the curve from by motor failures or insufficient BUR
● Stick/slip can be reduced through proactive parameter management along with a stick/slip mitigation system.
● Drill collars reduced vibration and provided better bit dull characteristics.
● Standardizing connection practices reduced the cumulative effects of back to bottom lateral vibration in the vertical section.
●Lateral specific connection and orienting practices are needed.
●The performance results and engagement could have been improved by having a project leader present at the rig site (as opposed to an office-based project manager and engineering staff) who determined the plans the field personnel were to follow.


 石油圈
石油圈