When the operator sanctioned the drilling automation pilot test in November 2014, the North Dakota Bakken drilling program consisted of 17 rigs with a goal to deliver 178 wells in 2015.
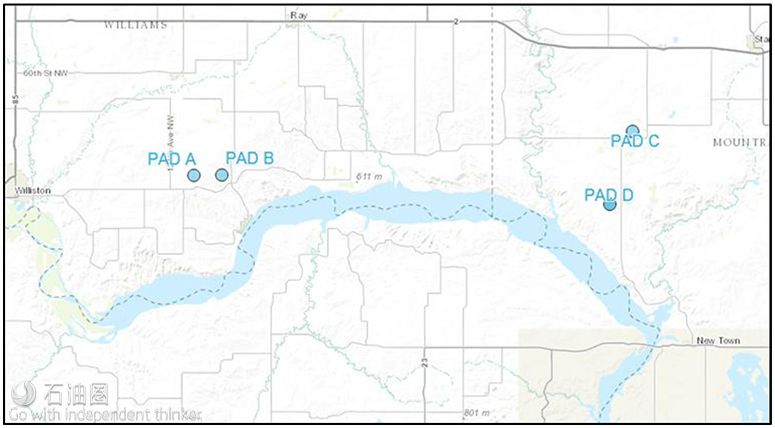
A fleet of this size meant there were good offset wells available for comparison. Areas around Lake Sakakawea presented a variety of drilling challenges with different formation depth trends and rock properties, which meant wells could also be compared within smaller areas. Drilling for this project took place on four different drilling pads in two different areas. Fig. 1 shows the locations of the wells for this study.
The operator selected the downhole automation system (DHAS) with 5 in. wired drill pipe, because it was believed the real-time, high-speed data feed would accelerate the learning process.
By making the downhole drilling environment visible in real time, the driller could apply this new understanding of the drilling environment to the automation system to optimize drilling performance. It was also envisioned that the large amount of data available from the system would feed the Plan, Do, Check, Adjust (PDCA)cycle and result in lessons learned and performance improvements that could be implemented across the fleet. The idea was to instrument one rig and use the lessons learned to improve the performance of the entire fleet. The primary project goals were reducing cycle time while achieving a breakeven cost for the additional technology.
At the time, there was significant variability in cycle time as well as a significant difference between the best and worst performing rigs. To assess the rate of improvement and, thereby, the potential of the DHAS to improve drilling performance, the operator selected a lower performance rig for the pilot test, as shown in Fig. 2.
The time interval selected was limited to the benchmark time interval for only the portion of the well operations that used the DHAS and the 5 in. wired drill pipe. The actions included in the benchmark time interval were as follows:
● Pick up vertical bottomhole assembly (BHA)
● Drill out surface casing shoe and perform formation integrity test
● Drill 8 ¾ in. vertical interval to kick off point (KOP)
● Round trip to change BHA for curve
● Drill 8 ¾ in. curve interval
● Trip out of hole with curve BHA
Drilling Automation System
The downhole automation system (DHAS) maintains full control of the downhole drilling environment by using high speed data transmitted through the wired drill pipe to the algorithm controlling the rig systems. In normal drilling conditions, the driller makes decisions based on drilling knowledge to surpass drilling performances. The time reaction from human interface is critical to control the drilling environment especially for drilling vibrations mitigations. The DHAS interacts with the draw works auto driller control system to take full control when engaged by the driller. The system can also be used during slide operations for directional drilling.
The system uses wired drill pipe to stream data from dynamic measurement tools to surface at high speed. This data can then be seen and used to make decisions on the surface at a rate of 0.4 Hz. The data is viewable by personnel at the rig site as well as remotely in the office. Some of the measurements from the tool streamed to surface include:
●Downhole weight on bit (WOB)
●Downhole torque
● RPM
● Gyro
● Lateral vibration
●Axial vibration
●Annular pressure
Along with high-speed data visualization streaming to surface at 0.4 Hz, select channels are sent to the surface at 80 Hz to allow for closed loop control of the auto driller. The system allows the user to input a desired downhole WOB measurement and then send commands to the auto driller to reach that measurement. This is accomplished by sending surface WOB commands to the auto driller and monitoring the resulting downhole WOB coming from the dynamic measurement tool. Others have provided more information on this system and its key components.
The DHAS was used in combination with other proven systems, such as a stick/slip mitigation system to help stabilize control of the drilling process.
The system execution team included members from the rig contractor, directional drilling provider, automation provider, and operator. In addition, two dedicated optimization engineers were placed at the rig site to provide interpretation of the real-time data feed and make recommendations for parameter adjustments to improve the performance of the system in the hole. The rig-site team was supported by an office team who managed the data analysis and project planning.
Drilling Improvement Process
Lean manufacturing processes implemented by energy companies continue to improve well construction delivery and the resulting production. Well construction teams use the basic PDCA improvement process to create and protect value by finding and addressing value limiters blocking a better result. The continuous improvement cycle consists of four key steps, described previously:
● Plan: Design the system to improve its function. Develop an implementation plan.
● Do: Implement the plan. Recognize and address problems with corrective action.
● Check: Analyze and recap results. Capture lessons and drive improvement.
● Adjust: Identify and remove a limiter. Find and address value barriers.
Value limiters are processes, materials, tools, or practices restricting the value of a well. There is always a controlling limiter determining value. Limiters are usually a part of the planned operations. The concept of a value limiter helps identify the system constraints controlling the delivery of a standard work process. ROP limiters are one type of value limiter and the focus of the drilling automation pilot project. In the automation project, there were three key PDCA improvement cycles:
1. Real-time cycle: Improves the performance of the system in the ground. This cycle primarily involved the well site team with some input from the office support team.
2. Run-to-Run cycle: Selects the best system to put in the ground from the options available. This cycle involved both the well site and the office support teams.
3. Well-to-Well cycle: Addresses the root causes of ROP limiters and redesigns the system and get its components to the wellsite. This cycle involved the office support team primarily with input from the wellsite team.
Simultaneously managing these cycles and analyzing large amounts of data proved to be a significant limiter in itself. Observation and analysis did not always agree, which resulted in more analysis to evaluate and assess the drilling system. The different visual data feeds and ways to consume downhole information also resulted in different viewpoints between wellsite and analysis teams. The resulting information and learning was fed into/out of each of the loops as possible at end-of-run after-action-reviews. Pre-drill meetings combined as much relevant information from the three cycles as possible to produce actionable results to wellsite operations.
Project Case Study
The team drilled wells on four different pads. Below are the findings and resulting improvements.
Pad A – Results and Improvements
The team drilled the first of the six wells on Pad A with conventional technology to benchmark a starting point. Pad A was considered a batch operation, meaning all six 8 ¾ in. vertical/curve sections would be drilled sequentially, followed by all 5 7/8 in. lateral sections. A typical well normally consists of two bit runs in the 8 ¾ in. vertical/tangent section, and one bit run for the 8 ¾ in. curve. In the past, vertical/tangent sections have been drilled in a single bit run, but experience has shown a planned bit trip in the Kibbey formation usually results in an improvement in ROP below the Kibbey compensating for the trip time to change the bit.
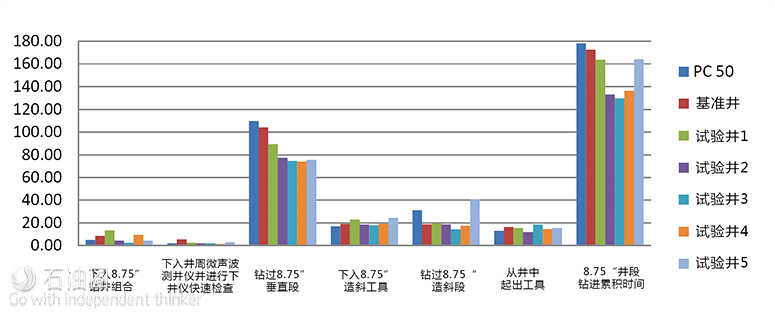
The bits, motors, and BHAs were kept the same for the first three wells so any performance improvements attributable to the new technology could be easily observed on the second and third pad wells. The BHAs were typical of those run in the area and consisted of a slick 6 ¾ in., 1.5° motor and measurement while drilling (MWD) tool with 10 stands of heavy weight drill pipe (HWDP). The bits were also typical to the area: six-blade polycrystalline diamond compact (PDC) bits with backup cutters. After drilling the first three wells, the run-to-run or well-to-well PDCA cycle would dictate the adjustments needed to bits or BHAs between runs. Fig. 4 shows the six wells and their cycle times for each of the measured operations.
● Benchmark Well: This well had no drilling automation and a cycle time that was 6 hours better than the average for the area.
● Well 1: The main objectives for this well were to install and function test the wired drill pipe and build crew familiarity with the system. The rig crews quickly adapted to the new technology and, as a result, the Well 1=s drilling performance was 14.5 hours better than the average.
● Well 2: Installed the stick/slip mitigation system. The crew quickly adapted to using it as the reduction in stick/slip down hole could be seen instantly with the real time data. The drilling performance improved substantially, saving 45 hours.
● Well 3: Eliminated the planned bit trip in the 8 ¾ in. vertical/tangent on this well by using the system to aggressively manage drilling parameters in order to reduce vibration and preserve the bit’s cutting structure. The average drilling time for the 8 ¾ in. interval was reduced by 48 hours.
● Well 4: Drilled the 8 ¾ in. vertical section on this well even faster, resulting in an overall savings of 42 hours. Added drill collars to the BHA which resulted in reduced vibration and helped preserve the bits cutting structure.
● Well 5: Completed the 8 ¾ in. vertical section in one run for a third time. However, build rate issues in the curve eliminated a portion of the time savings, resulting in 14 hours saved overall.
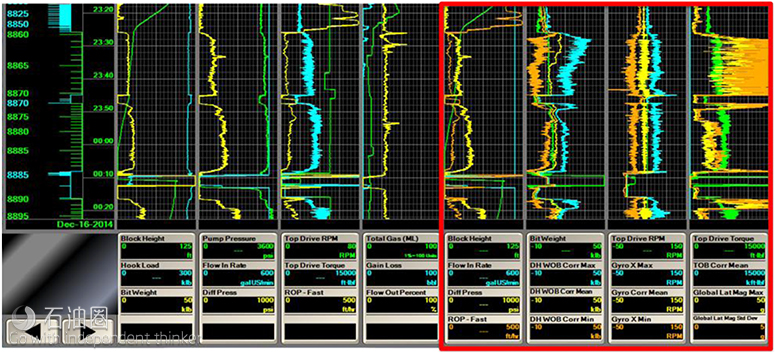
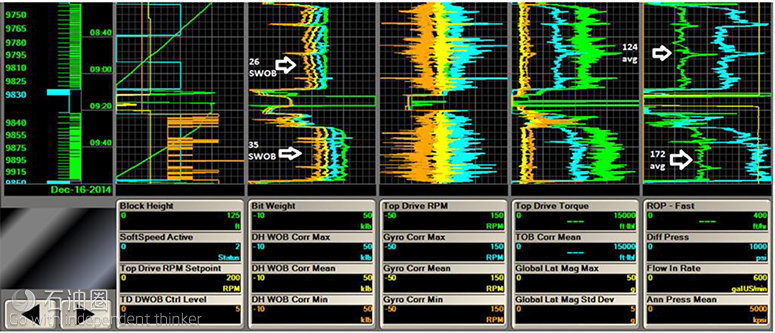
Fig. 5 shows an example of the driller’s display with the additional downhole channels displayed in the red box. In this example, the surface parameters show a stable drilling process with little variation while the downhole channels, especially the lateral vibration (labeled Global Lat Mag Max), show the presence of whirl with over 50 g. Drilling conditions are stabilized when more WOB is applied.
Fig. 6 illustrates the function of the DHAS as it increases surface WOB to reach the downhole WOB set point. This increases ROP by 27.5% while the downhole data shows the drilling environment is still safe at more aggressive parameters.
The office-based optimization team examined the bit dull photos after each run to determine the cause of damage and evaluate the results of changes made during the run. Fig. 7 displays the bit wear for the vertical run in Well 3 (no drill collars) and Well 4 (12 drill collars). Well 4 with the drill collars shows a reduction in cutter wear.
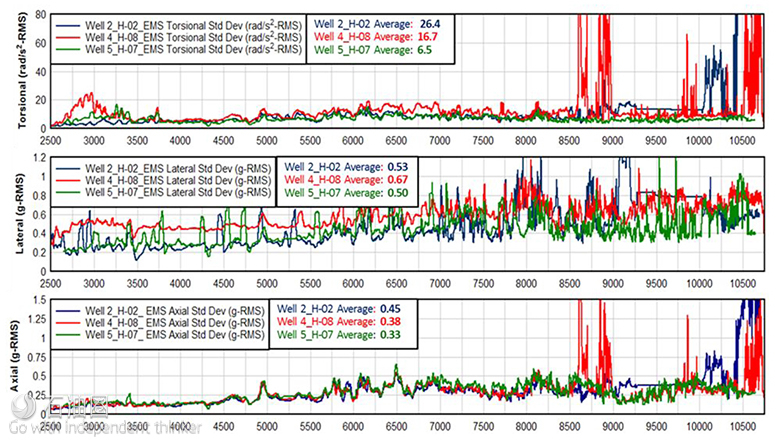
The office-based optimization team performed a post-pad analysis to determine the effects of running drill collars in the BHA. The results were lower levels of torsional, lateral, and axial vibration, with torsional vibration seeing the most significant improvement. In Fig. 8 the vibration levels are charted for Wells 2, 4, and 5. Wells 2 and 4 were drilled with HWDP only and Well 5 was drilled with HWDP and an additional 12 drill collars. Well 5 showed a significant decrease in vibration in the vertical interval and was drilled in one run.
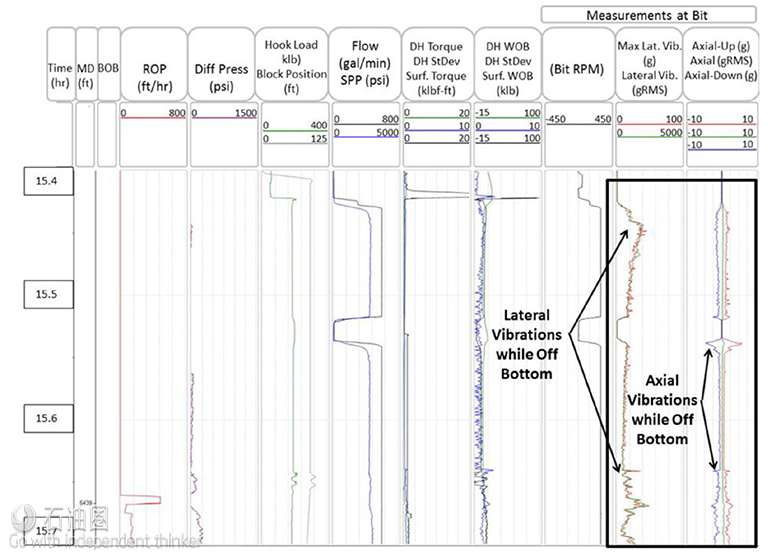
Off-bottom vibrational tendencies were another key performance limiter observed during the project in both the vertical and the curve sections. Currently, standard on-bottom practices at the rig site involve activating the auto driller off bottom and ramping up the ROP until on bottom. Vibration was observed in the vertical section while performing this operation. It occurred while going back to bottom after making a connection as shown in Fig. 9. On a single connection, this type of vibration may have little impact on bit life. However, 80–90 vibrations of this type can greatly increase bit wear and result in lower ROP or premature bit trips.
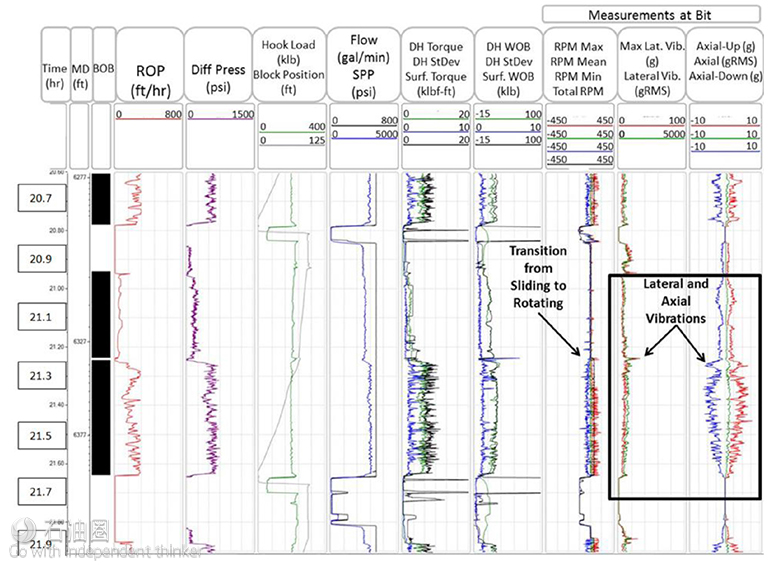
Vibrations were also observed while making the transition from sliding to rotating during a stand in the vertical section of the wellbore as shown in Fig. 10. These vibration levels are higher than those observed on connections and can result in more rapid bit wear and slower drilling.


 石油圈
石油圈