Nanotechnology has delivered many ingenious solutions to the problems of hydrocarbon exploration and production, solutions that are already finding acceptance as commercial products. Deeper understanding of chemical and physical phenomena at the 1 nanometer (nm) to 100 nm scale has resulted in the development of superhydrophobic and superhydrophilic coatings, soluble metal alloys used in hydraulic fracturing1, 2, near wellbore fines control agents3 and shale- inhibiting water-based drilling fluids4. Another promising area of nanotechnology application in hydrocarbon exploration and production lies in the use of engineered nanoparticles as reservoir traversing agents capable of monitoring or changing reservoir conditions. Several of these applications, such as superparamagnetic nanoparticles — for electromagnetic imaging contrast enhancement — oil sensing nanoparticles, surfactant nanoparticles and nanoparticle tracers, are already in fairly advanced stages of laboratory development.
Obviously, the feasibility of any nanoparticle-based reservoir agent is contingent upon its ability to survive the harsh conditions found in hydrocarbon-bearing formations until its mission is accomplished. Among the most difficult challenges are the high salinity and hardness of connate water, high temperatures and the presence of a vast, chemically active rock surface. Therefore, the design of any potential reservoir nanoagent must take these challenges into consideration even before trying to impart any useful functionality to it. Providing a particle, which is by itself incompatible with reservoir conditions, with a suitable coating has been tried in extensive tests and resulted in markedly improved stability relative to flocculation and adsorption. Yet the improved stability was still insufficient to facilitate particle migration through any but trivial distances of reservoir rock, represented in tests by either a packed column of formation “sand” or core plugs.
The rational approach to reservoir nano-agent design was helped in our case by a fortuitous discovery of small carbogenic nanoparticles, A-Dots. The A-Dots can fit through even the finest pores of the carbonate rock found in the Arab-D formation as their diameter is below 10 nm, and they are brightly fluorescent to allow easy detection and quantification. Whereas their surface chemistry is yet to be fully understood, it makes them remarkably inert under the conditions of the Arab-D reservoir — i.e., up to 22% total dissolved solids, 100 ºC temperature, and 3,200 psi pore pressure. In a previous article8, we demonstrated close to 86% recovery of the A-Dots from the reservoir in a huff-and-puff single well test. This article provides details on a subsequent successful test of A-Dots’ migration through industrially meaningful distances of reservoir rock that confirmed their usefulness as a stand-alone fluorescent reservoir nano-agent.
FIELD OPERATION
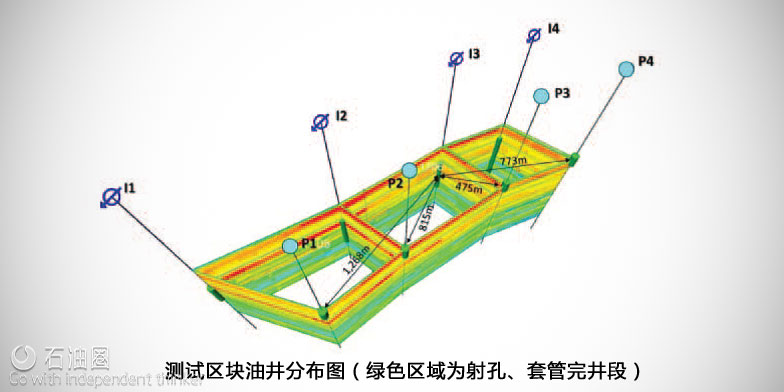
The field trial was undertaken on a configuration made up of four pairs of injector-producer wells, Fig. 1. Wells in each pair are separated by a distance of nearly 2,000 ft at the surface. The wells are drilled in a mature, well flooded area to the base of the Arab-D reservoir — to 7,500 ft. These are all vertical wells that are cased and perforated. Well-I1 to Well-I4 are four power water injectors injecting seawater at roughly 8,000 barrels per day (BPD) per well. Well-P1 to Well-P4 are producing at 8,000 BPD per well. Injection and production operations in these wells had been ongoing for more than a year at the time of the A-Dots test. The water cut in these producers exceeds 95%. Previously, the team had conducted inter-well chemical tracer tests as part of the monitoring and surveillance program for the same area. The objectives of the tests were to determine the flow paths and connectivity between the injector-producer pairs and to conduct conformance mapping. At the time that we decided to test the A-Dots, the connectivity from Well-I3 to Well-P3 had been established using chemical tracers. Accordingly, we decided to inject in Well-I3 and monitor breakthroughs at all four opposing producers, Well-P1 to Well-P4.
The layout of the wells in the test area. The green cylinder along each well’s axis depicts the perforated zone in the casing. The reservoir formation layers are represented in colors in the 2D vertical planes between wells. A-Dots were injected into the reservoir at Well-I3 and are being monitored at all four producer wells, Well-P1, Well-P2, Well-P3 and Well-P4.
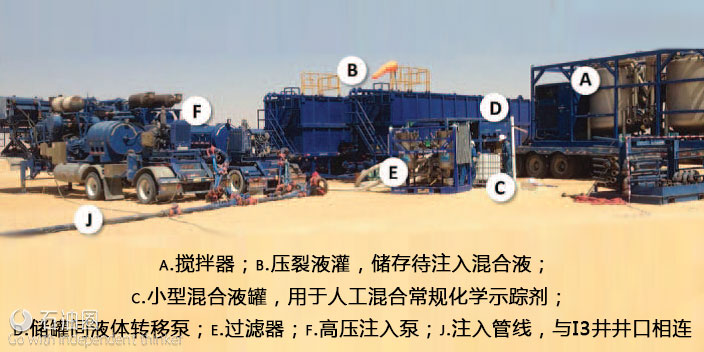
The operational setup for the A-Dots’ injection field operation. A total of 300 kg of A-Dots tracer was added to 650 barrels of injection water. The A-Dots’ concentration in the mix was close to 3,000 ppm. In addition to the A-Dots, we decided to add fluorescein sodium salt (NaFl) to the mix as a supporting tracer. Its extensive use has been reported in the literature in geothermal applications with highlighted stability in hyper saline brine conditions in these wells. We manually mixed 100 kg of this material in water before transferring it to the blenders for mixing with the A-Dots. The final concentration of the NaFl in the injection mix was on the order of 1,000 ppm. The tracer mix was filtered to 50 m to remove impurities and avoid damaging the well. The tracer’s injection was done offline from the seawater injection operation at Well-I3. The injection rate of the tracer mix into Well-I3 averaged 6.5 barrels per minute (BPM). This is well below the well’s capacity of 10 BPM. Immediately after finishing injection, the test well was put back online and normal seawater injection resumed into the well.
The operational setup of the test of A-Dots in the field: (a) blenders for high volume mixing, (b) frac tanks for holding injection-ready fluid, (c) a small mixing tank for manual mixing of the conventional chemical tracer, (d) a small pumping unit to transfer fluids between tanks, (e) a filtration unit, (f) highpressure injection pumps, and (j) an injection line connected to the wellhead at the test well, Well-I3.
SAMPLING AND ANALYSIS
The four producer wells chosen for the test were monitored twice a week as field conditions permitted. Samples of produced water — 2 liters from each producer well — were collected from a sampling line near the wellhead. The line was flushed of waste before collecting each sample to avoid contamination with fluorescent impurities. Collected samples contained a significant amount of crude oil — 2% to 5% — that had to be removed before doing any spectrophotometric measurements. The water and oil were allowed to separate for three days, and the water layer was sampled with a glass syringe equipped with a new stainless steel needle. The aliquot of water(100 ml) was then extracted with 10 ml dichloromethane; the extraction was repeated three times. The dichloromethane treatment removed the residual micro-droplets of oil, which were brightly fluorescent in the spectral region of interest, along with a part of undetermined water soluble fluorescent impurities. Overall, the dichloromethane treatment reduced the background fluorescence of the samples by a factor of about 3.
A control experiment using a solution of A-Dots — 1 ppm in synthetic brine with the same ionic composition as produced brine — treated with dichloromethane in the same fashion demonstrated that the loss of A-Dots to this treatment was undetectable. To minimize the effects of the inherent instability of the xenon arc discharge used as the light source in our spectrofluorometer and the photomultiplier tube used as the detector, we employed an internal standard of rhodamine B, added to all samples at 0.1 ppm. Therefore, all collected spectra were normalized to have the emission peak of rhodamine (λem = 575 nm) at the same intensity. Normalized spectra of rhodamine in labeled water obtained from each respective producer at the very beginning of the test were used as backgrounds for subtraction.
The A-Dots were detected at levels significantly exceeding the noise in the paired producer well, Well-P3, nearly 50 days after the injection, Fig. 3. This preliminary result is in line with previous tests that used conventional chemical tracers. Thereafter, the concentration of the nano-agent increased steadily, confirming the observed breakthrough. To quantify the ADots, calibration curves were built using a sample of injection solution obtained from the injection tank and kept at 100 ºC in a tube sealed with a screw cap for the duration of the test to account for possible losses of fluorescence due to reactivity with the water.
CONCLUSIONS
Future implementation of nanoparticle-based technology in the oil and gas industry is contingent upon the survival of the nanoparticles in the presence of injection fluids, formation fluids and connate water, high reservoir temperatures and chemically active rock surfaces over periods of time — ranging from months to years — sufficient for them to reach the targeted areas of the reservoir. Therefore, we designed a test to demonstrate successful recovery of fluorescent nanoparticles — A-Dots — after they traveled through several hundreds of meters of carbonate reservoir rock deep underground. The particles as a dispersion in filtered seawater were injected into the Arab-D formation within a watered out part of the Ghawar reservoir operated under linear drive conditions. Four nearby wells were monitored weekly for the particles’ presence with fluorescent spectrophotometry of the produced water, and their breakthrough into at least one of the wells was detected. This is consistent with previous tests in the same area that used conventional chemical tracers.
The long-term survival of A-Dots in actual reservoir conditions opens new horizons for the development of reservoir nano-agents with a functionality beyond simple passive tracers through the application of similar surface chemistry and structure to their design. The A-Dots themselves could also be developed into a commercially attractive industrial fluorescent tracer, owing to their low cost and nontoxic nature.

 石油圈
石油圈


