Real-Time Data Acquisition and Calculations
One of the most important features of any Coiled Tubing data acquisition software is the ability to track fatigue and monitor stresses in the Coiled Tubing during an actual job. Tis feature is important to help ensure that no failures occur during an operation.
Fatigue Prediction and Monitoring
Halliburton has developed a comprehensive String Management System. Tis system incorporates software and real-time Data Acquisition for fatigue monitoring and Life Prediction. In addition, the String Management System includes processes for keeping track of the remaining life of each string, inspection and spooling processes, and procedures for storing Coiled Tubing strings.
Halliburton’s InSite for Well Intervention software package uses our proprietary fatigue model developed from extensive empirical data compiled by Vladimir Avakov. The Design Module of InSite for Well Intervention can be used as a modeling tool to predict fatigue for Coiled Tubing string design. The simulator features an Analyzer to compare multiple cases and optimize the material, diameter, and wall thickness(es) of the string. To calculate the fatigue, the job is run in the Stage Table, and then pre- and post-job fatigue can be compared. The program can accept various inputs in the Stage Table without permanently altering critical fatigue data. When used in real-time, fatigue accumulation is calculated as the job progresses.
Features of the Fatigue Calculator/Simulator include:
•Calculates which segments along the string undergo bending events.
•Calculates the changes to the bending radius at the reel as the Coiled Tubing is run into and out of the well.
•Displays the used life along the string as it accumulates.
•Creates a permanent and ongoing record of fatigue damage to a CT string.
Using the InSite for Well Intervention fatigue-analysis software, the remaining life of the string and welds can be predicted. Prejob simulations of the planned work including contingencies can be simulated and life-used peaks predicted.
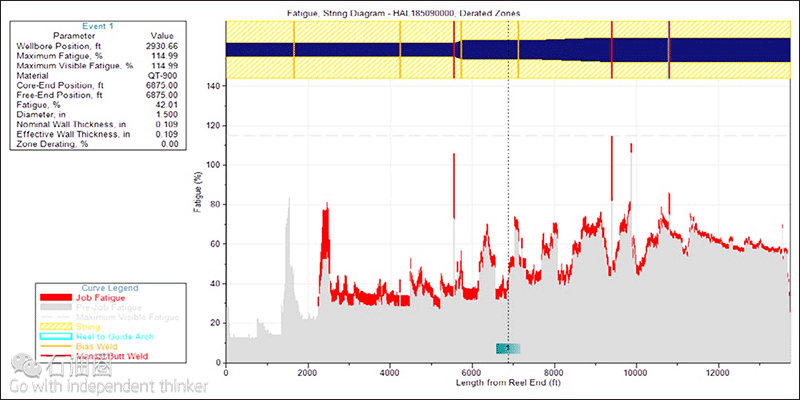
The following graphic shows the output from the real-time InSite for Well Intervention Fatigue Viewer. Note that the fatigue accumulated during the current operation is clearly visible (in red) against the previous fatigue.
The previous graphic shows the percentage of used life. The upper display gives a graphical interpretation of the string itself, where the taper occurs noted as a change in ID and where welds occur, indicated by different colored lines to represent the different types of welds.
Extensive testing and field evaluations have proven the consistency and reliability of Halliburton’s fatigue life model. Halliburton takes a conservative approach to tubing life and retire our strings before ovality becomes a concern. Whereby others in the industry utilize tubing ovality as a major factor in their string retirement criteria, Halliburton’s fatigue life model takes into account several more factors. These include job exposure type (acid, H2S, CO2, etc.), internal and external pressures, and the number of cycles.
Real-Time Calculations
Throughout any Coiled Tubing operation, stresses can be calculated and monitored at multiple positions to help ensure different types, and locations of failure can be predicted and, therefore, possibly avoided.
Surface Stresses
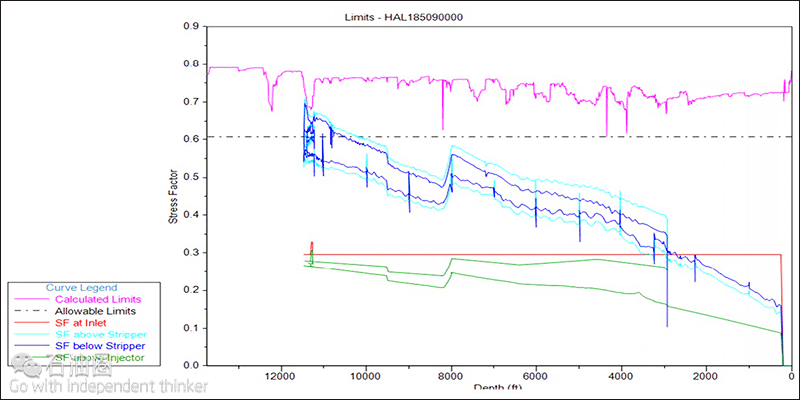
Using measured values of pressures and loads on the surface, stresses are calculated at four key locations of the Coiled Tubing surface setup. These values are shown in real-time on a chart to give the operator a visual warning of when high stresses are being encountered. The following graphic shows an example of the graphical means of tracking surface stresses in the Coiled Tubing during an operation.
Downhole Calculations
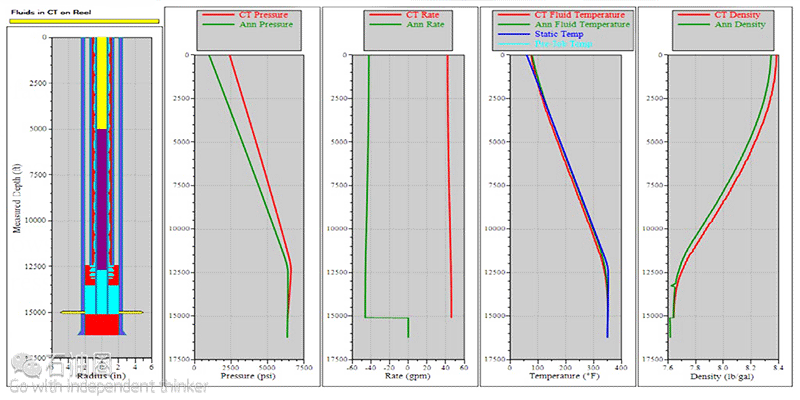
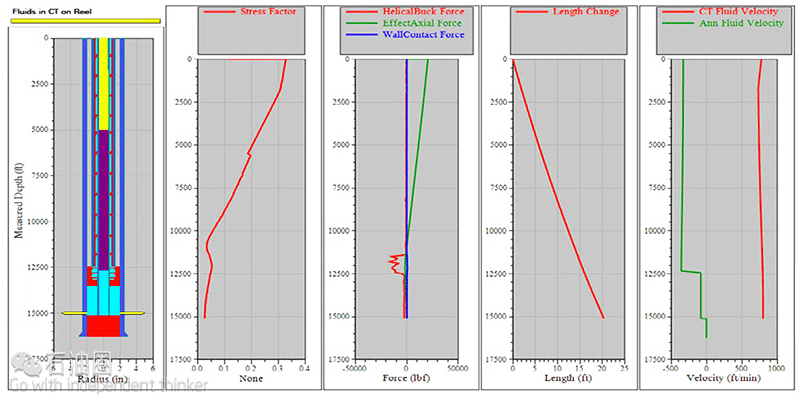
As well as calculating surface stresses in the Coiled Tubing, InSite for Well Intervention also can calculate downhole stresses along with various other parameters, which can be graphed in real-time as the job progresses. These calculations are made by using known values of pressure and depth combined with given variables such as fluid weights and volumes to provide the operator with a greater knowledge of well activity. Tis enhanced knowledge can help the operator make job changes.
The following charts show some of the downhole calculation possibilities and also demonstrates the real-time fluid-tracking ability (represented by different colors) in the wellbore.
Operator Display
To simplify all available data for the Coiled Tubing operator, Halliburton has developed a very powerful operator display that summarizes all important data onto one easy-to-read graphical interface, as shown in the following screenshot. Tis display is completely customizable.
The main features that have been developed for the operator display include the following:
•Fully dynamic limits bands on the edges of the gauges. Note the red and green bands on the gauges, which provides notification to the operator to keep the parameters within the green areas to help ensure no risk of failures.
•An advanced warning screen. Warnings appear for the following scenarios:
If stresses on the Coiled Tubing string (on surface or downhole) are approaching limits
When welds or high fatigue areas are approaching the level wind or injector
As the BHA approaches the surface or any changes in downhole wellbore geometry
•Fluid totalizers are customizable to handle multiple fluids
Advanced Design Calculations
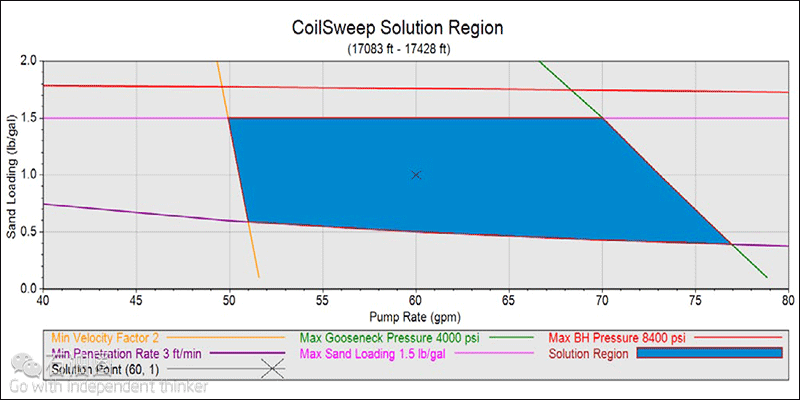
Halliburton is currently developing InSite for Well Intervention to have the ability of carrying out job design calculations for common job types such as sand cleanout and nitrogen lifting.
Tis new feature will also incorporate Halliburton’s proprietary CoilSweep and Hydra-Blast specialist tools. The following example shows a safe operational envelope that has been calculated to assist the engineer and operator while performing a sand cleanout with Coiled Tubing.
Friction Matching
To optimize future operations, we can learn a lot from previous operations. When a job is designed, certain parameters must be estimated. One significant parameter, particularly in deviated wellbores, is the friction coefficient between the Coiled Tubing and the wall of the wellbore. This value has the most influence on how far we can push Coiled Tubing along an extended reach well. Factors such as condition of the wellbore tubulars, type of wellbore section (open hole, slotted liners, etc.), fluid type in the well, etc. affect this number and can make significant differences to a job design.
When working on a series of similar wells, we can look back at previous operations to verify the validity of all the assumptions made on past operations by fne tuning the design until they closely match the actual post job field data. These calculated values of friction can then be applied to any subsequent operations helping ensure that our job designs have the best chance of success and the most suitable equipment to carry them out is on location from the start.
The following graph is an example of post job friction matching; the software also has the capability of calculating friction matching in real-time while the operation is being carried out.
ACE Equipment on FLECS Control System
The ACE (Automatic Controlled Equipment) operating system installed on the FLECS (Flexible Electronic Control System) hardware gives the operator a control system with built-in safety features and Ethernet connectivity. The ACE operating system is the same platform used to control other Halliburton equipment such as pumps and blenders, giving uniform functionality on location.
All of the critical Coiled Tubing operational information is on display at the same time, which can be configured and set using keyboard, mouse, or a touchscreen interface.
The safety features included with this control system are as follows:
•Basic Controls
•Stops injector, based on tag, over pull, weight or speed limits
•Advanced Controls
•Improved limit system
•“Soft” stop ramps down injector speed at higher speeds, avoiding equipment damage
•Automatic chain lube system
•Tubing slip detection
•Chain life (stretch) indication system


 石油圈
石油圈
