通过对2015年的一次油价虚假反弹现象的深度剖析,警告世人本月的油价涨势不过是昙花一现。并非市场重新走向平衡的前兆,反而是市场价格极度敏感脆弱的体现。
毫无疑问,今年2月中旬开始反弹的油价会再次走向崩溃。
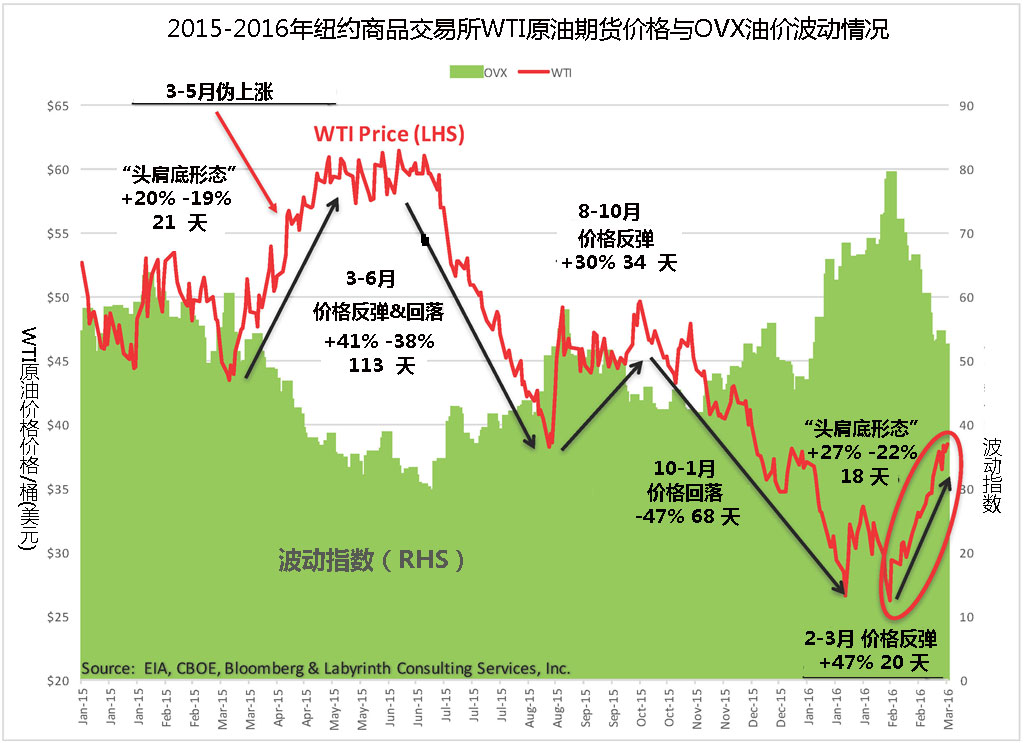
如同2015年3月至6月的伪反弹一样,市场上的不理智情绪造成了油价的上涨。上一次的伪反弹,主要是由于原油库存量过大且需求量增长势头较弱,难以长期维持较高的价格。自今年2月中旬起,WTI原油价格在20天内从26.21美元升至前不久的38.50美元,增加了47%(图1)。石油圈原创,石油圈公众号:oilsns

而一年前,WTI原油期货价格同样35天内上涨41%,从每桶43美元涨至近61美元。当时的分析师认为油价已经触底,结果在60美元附近只维持了37天,于同年8月份下跌至每桶38美元这样一个新低点。在那之后,油价不断的刷新其“底价”,一直到不久前的26美元/桶。
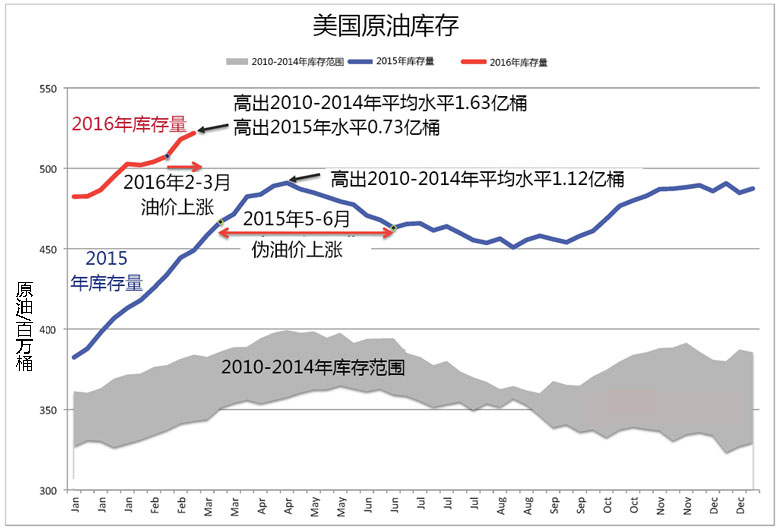
去年的价格上涨也只是昙花一现,追其原因主要是由于原油库存量已高出5年内平均水平约1亿桶(图2)。而如今的库存量比一年前还要多出5千万桶,且还在不断增加。石油圈原创,石油圈公众号:oilsns

国际原油库存变化情况也显示出了相同的趋势。经合组织(OECD)原油库存为31亿桶,高出2010 – 2014年的平均水平4.31亿桶之多,高出2015年的水平3.59亿桶。其中光是美国的库存就占了约三分之一(13.5亿桶原油)。
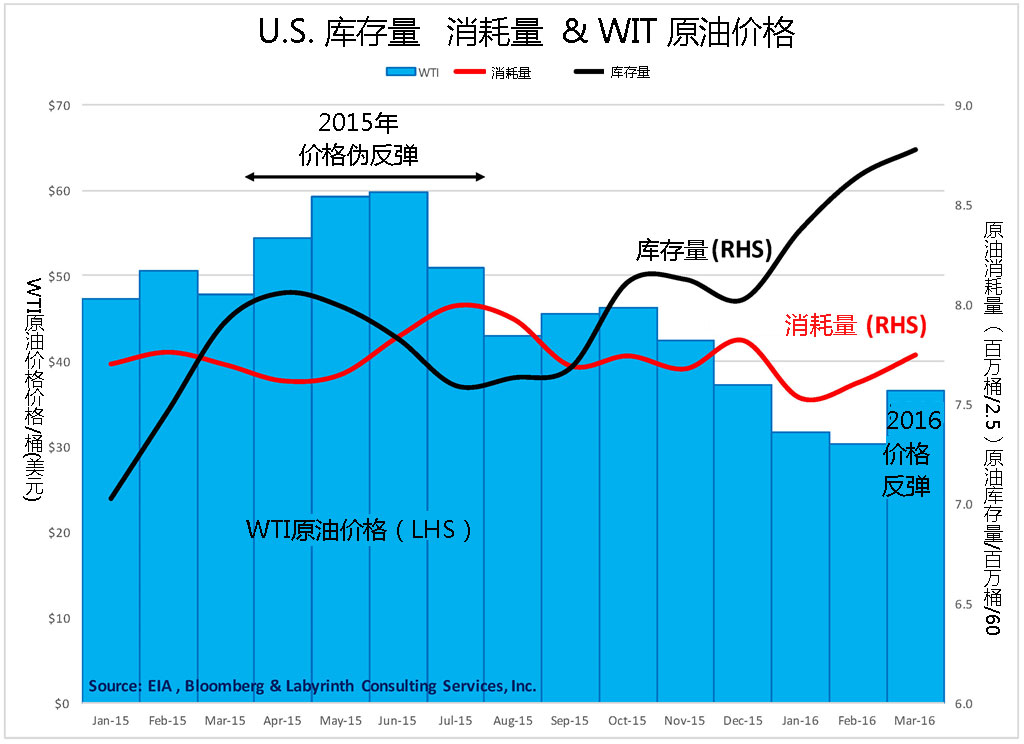
2015年美国原油消耗量变化趋势同库存量呈负相关(图3)。2015年的价格反弹期间,4月和5月原油消费量开始增加,市场反应往往会滞后几个月,随后原油价格跌至2009年3月以来的最低点。2015年第一季度平均价格为47.54美元/桶,2010年11月到2014年9月(44个月)间的平均原油价格超过99美元/桶。石油圈原创,石油圈公众号:oilsns

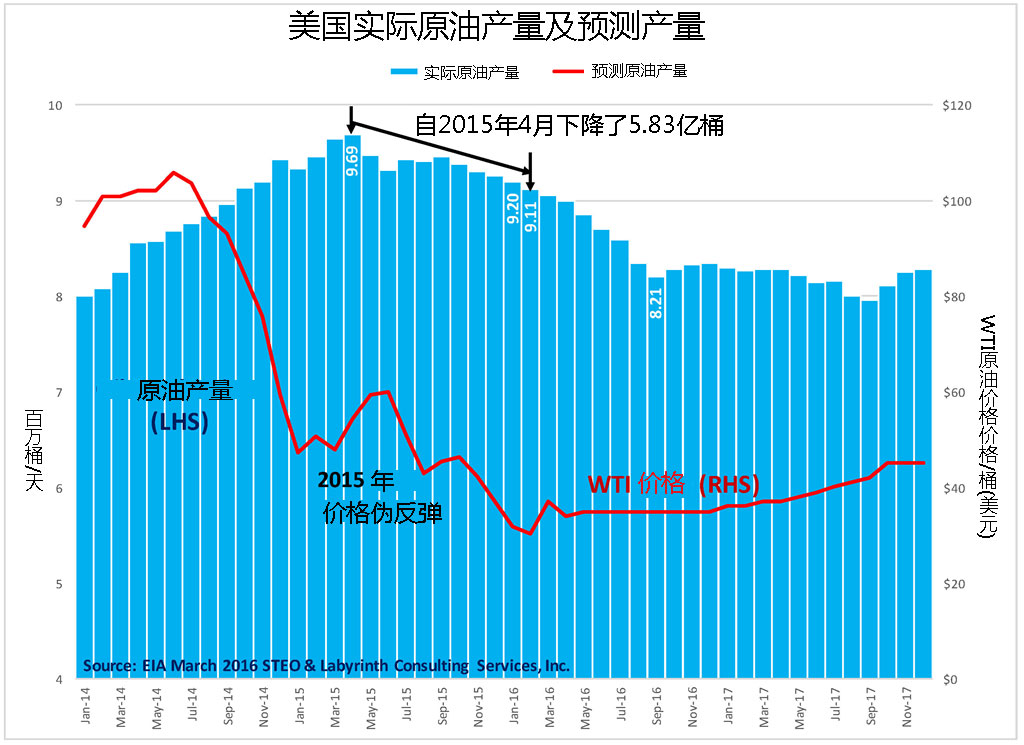
与此同时,2015年4月美国原油产量开始下降(图4)。

净库存消耗量一直持续到7月份,此后便一直下降,对应的油价一直上涨至60美元/桶。从去年6月到11月油价回升,石油产量增加,但油价在11月份之后便下跌至更低的低点。总之,一系列复杂的市场变化显示出当前的市场对于微小的价格、原油产量及消耗量的波动都极为敏感。石油圈原创,石油圈公众号:oilsns
去年仅仅15美元的价格波动就足以抑制原油的消费趋势,而特别值得我们注意的是此次的价格反弹量已经达到了12美元/桶,并且涨幅更大。
为什么要关注原油库存问题
虽说大多数的分析师都会关注原油库存量,可我们普遍认为市场平衡是一个简单的供给和需求之间的平衡。很难去准确估计美国的石油产量,实际情况的统计只能在数月之后做,且EIA只在报告中计算实际产量而非预计供应量、实际消耗量而非原油需求量。
这是因为供给量和需求量关系只能通过评估库存的变化以及库存如何调节实际生产和消费来判断。产量加库存量等于供应量。如今原油市场供过于求,消费加库存减少量等于需求量。石油圈原创,石油圈公众号:oilsns
去年4月以来,美国产油量下降了58.3万桶/天。然而在1.63亿桶的原油库存状态下,美国原油这一净减产量可以忽略不计。这就是为什么我们强调原油库存必须下降到2011 – 2014年的范围内才真正称之为有意义价格上涨的原因。这种假设的前提是原油需求量可以不受价格升高的影响。
低需求量及低储存价格是导致石油储量不断积累的原因。油公司更愿意每月支付约0.65美元/桶的仓储费用,一边通过期货合约销售原油,一边坐等需求量增加、原油现货价格上涨之日。人们普遍认为期货价格是对未来价格的一个合理的指向。事实并非如此,期货价格主要反映期货合约的供给和需求关系。石油圈原创,石油圈公众号:oilsns
在没有办法忽视期货交易对油价产生深远的影响前提下,WTI期货市场几乎成了世界上最大的“赌场”之一。期货价格走势往往会与市场情绪或者世界重大事件紧密相关,基于基本面的行情走势往往很难较基于情绪和偶然因素影响的行情持续的时间更长。
市场平衡被打破
而这一次的油价上涨,主要原因是由于美元的明显贬值,还有一部分原因是市场寄希望于OPEC和俄罗斯的减产行为。不过直到现在这两家都没有公开发表减产公告。也许这一次所谓的“减产”换来的还是毫无意义的产量冻结。有些人片面地认为,各国间关于石油产量冻结的对话可能导致近期一段时间的减产行为。我同意这一点,但这绝不是油价涨幅接近50%的合理解释。
我预测此次价格涨势如同2015年一样只能持续短暂的一段时间。同时我也在思考有哪些主要因素会造成影响如此深远的持续价格反弹。不过随着低油价的持续,我意识到油价与石油产量之间这种简单的对应关系已被打破。不知何故,似乎在2014年9月份之前控制石油市场的那些基本原理已经不起作用了。2008年金融危机之后的债务危机以及紧随之后的宽松货币政策,已对世界经济已造成了沉重的打击和深远的影响。石油圈原创,石油圈公众号:oilsns
在不久的将来,原油储量的持续消耗加上新产能投资不足问题将使石油价格走向高位。全球经济将也会得到恢复。通过此次研究,我意识高油价并不是以一个直接简单的形式回归。由于经济发展主要依靠能源而非资本,因此石油市场是更广泛的经济领域的先导指标。
价格和需求的关系貌似存在着一定的适用范围。需求上的小波动使得价格的抬升或降低,直到这种价格变化对需求量产生负反馈作用。而在宽松货币政策的背景下,生产就像一台不知疲倦的机器,无论价格或利润多低都一刻不停地运转。目前石油市场供大于求的状况就是这样形成的。石油圈原创,石油圈公众号:oilsns
现在的全球产油量似乎正在下降。当然,这是走向市场平衡的必要且方向正确的一步。毫无疑问,2016年OPEC与俄罗斯的减产将市场推向某种平衡状态。但是我预测这种新的平衡同2014年油价崩溃之前相比,油价和需求总量都会更低。
作者/Arthur Berman 译者/朱丹 编辑/王月
The oil-price rally that began in mid-February will almost certainly collapse.
It is similar to the false March-June 2015 rally. In both cases, prices increased largely because of sentiment. As in the earlier rally, current storage volumes are too large and demand is too weak to sustain higher prices for long.
WTI prices have increased 47% over the past 20 days from $26.21 in mid-February to $38.50 last week (Figure 1).
A year ago, WTI rose 41% in 35 days from $43 to almost $61 per barrel. Like today, analysts then believed that a bottom had been reached. Prices stayed around $60 for 37 days before falling to a new bottom of $38 per barrel in late August. Much lower bottoms would be found after that all the way down to almost $26 per barrel at the beginning of the present rally.
Higher prices were unsustainable a year ago partly because crude oil inventories were more than 100 mmb (million barrels) above the 5-year average (Figure 2). Current inventory levels are 50 mmb higher than during the false rally of 2015 and are they still increasing.
International stocks reflect a similar picture. OECD inventories are at 3.1 billion barrels of liquids, 431 mmb more than the 2010-2014 average and 359 mmb above the 2015 level. Approximately one-third of OECD stocks are U.S. (1.35 billion barrels of liquids).
For 2015, U.S. liquids consumption shows a negative correlation with crude oil storage volumes (Figure 3). During the 2015 false price rally, consumption began to increase in April and May following the lowest WTI oil prices since March 2009–response lags cause often by several months. First quarter 2015 prices averaged $47.54 compared to an average price of more than $99 per barrel from November 2010 through September 2014 (44 months).
This coincided with the onset of declining U.S. crude oil production after April 2015 (Figure 4).
Net withdrawals from storage continued until consumption fell in July in response to higher oil prices that climbed to $60 per barrel in June. Production increased because of higher prices from July through November before resuming its decline after prices fell again, this time, far below previous lows. This complex sequence of market responses shows how sensitive the current market is to relatively small changes in price, production and consumption.
Most importantly, it suggests that a price variation of only $15 per barrel was enough to depress consumption a year ago. That has profound implications for the present price rally that is now $12 per barrel above its baseline and has already increased by a greater percentage than the 2015 rally.
Why Storage Matters
Although most analysts pay attention to storage volumes, market balance is generally thought of as a simple balance between supply and demand. But U.S. production is difficult to measure with confidence until several months after-the-fact and the EIA reports crude oil production but not supply. Likewise, EIA reports consumption but not demand.
That’s because supply and demand can only be determined by evaluating stock changes and how storage modulates production and consumption. Production plus available storage equals supply. In today’s over-supplied market, consumption plus withdrawals from storage equals demand.
Since April, U.S. production has declined 583,000 barrels of crude oil per day. With 163 mmb of crude oil in storage, that net production decline could be eliminated and April levels of production maintained by storage withdrawals for more than 9 months. That is why storage volumes must fall probably into the 2011-2014 range before a meaningful price rally can be maintained. That assumes that demand can tolerate those higher prices.
Oil is accumulating in storage because of low demand and low prices. It makes more sense to pay the monthly storage cost (~0.65 per barrel) and sell the oil forward with ongoing futures contracts until the spot price increases and, hopefully, demand also increases.
Many people think that the strip of futures contract prices are a reasonable guide to future prices. They are not. Futures prices mostly reflect the supply and demand of futures contracts.
That in no way discounts the profound effect that futures trading has on oil prices. The WTI futures market is one of the biggest gambling casinos in the world. Bets are often made on sentiment that in turn is related to world events. Price fluctuations that are based primarily on sentiment, however, have little chance of lasting longer than the sentiment or related events that produced them.
Crossing A Boundary
The current oil-price rally is based partly on a weaker U.S. dollar but mostly on hope that OPEC and Russia will cut production. For now, that is not even on the table. Rather, a somewhat meaningless production freeze is possible. Some rightfully believe that a dialogue about a production freeze may lead to a production cut some time in the relatively near future. I agree with that but it is a rather empty reason for oil prices to increase by almost 50%.
It would not surprise me if this price rally lasts awhile like the 2015 rally. I am interested in the requisite conditions that would allow a meaningful and sustainable price rebound. Early in the 2014 oil-price collapse, I thought it was a relatively straight-forward matter of reducing production so that the market could balance.
As low prices persisted, I recognized that a boundary had been crossed and that somehow, the principles that seemed to govern oil markets before September 2014 no longer applied in the same ways. I now believe that the world economy has been substantially weakened and injured by debt following the 2008 Financial Collapse and the easy-credit monetary policies that followed.
At some time in the not-too-distant future, the relentless depletion of legacy production and underinvestment in current exploration and production will result in much higher oil prices. The global economy will have to be much stronger to adjust to that.
The investigation I have presented here about the possible similarities between the present increase in oil prices and the false price rally of March-June 2015 reinforces my sense that a return to higher oil prices is not at all straight-forward. Oil markets are a leading indicator for the broader economy because the economy runs mostly on energy and not so much on money.
It seems that price and demand may be range-limited. Small changes in demand move prices up and down until those price changes feed back to changes in demand. Production has been like a machine working tirelessly in the background as easy money has kept it moving regardless of low prices and the absence of profit. That is how distorted the market has become.
World production now appears to be falling and that is certainly a necessary step in the right direction toward market balance. I anticipate an OPEC plus Russia production cut in 2016 and that will unquestionably move the market to some kind of balance. I suspect, however, that the new balance may be one in which prices and demand both remain lower than on the other side of the price-collapse boundary that was crossed in 2014.
未经允许,不得转载本站任何文章:

 石油圈
石油圈


