
EIA全球能源公司财务回顾报告出炉啦,先来一睹为快!
来自 | EIA
编译 | 阿佳徐 莹莹
近期,EIA公布了2017年第一季度油气业财务回顾报告。这份报告重点关注全球107家油气公司(能源公司)的财务和运营状况,报告数据来源于各大油企呈交给美国证券交易委员会的财务报表。
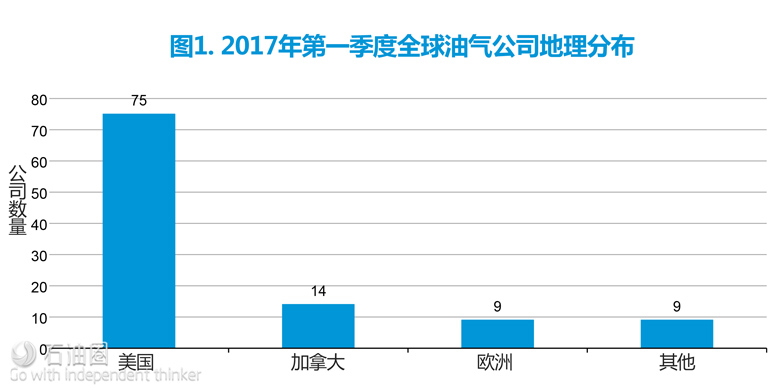
如图1所示,此次107家公司中,大部分为美国石油公司,达75个。
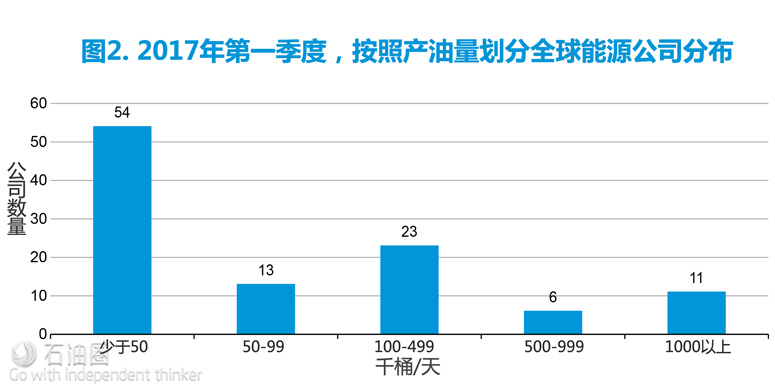
2017年第一季度,按照产油量划分,产量少于5万桶/天的能源公司占大多数,为54个;其次是产油量在10-49.9万桶/天的公司,为23个。如图2所示,大多数产油商仍以中小型公司为主。
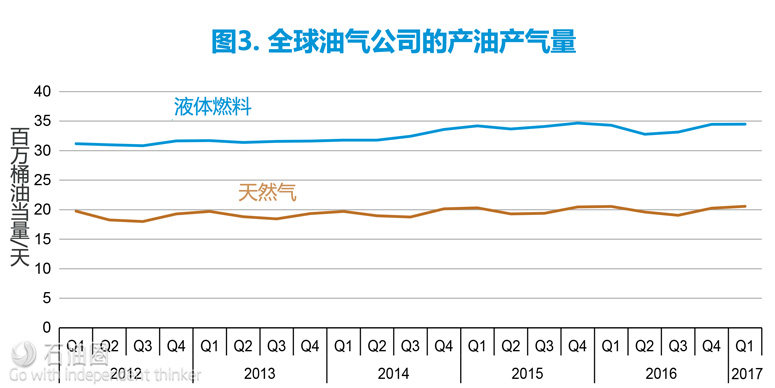
由图3可知,从2012年到2017年第一季度,全球油气公司液体燃料产量呈稳步上升趋势,天然气产量基本保持在2000万桶油当量/天上下。
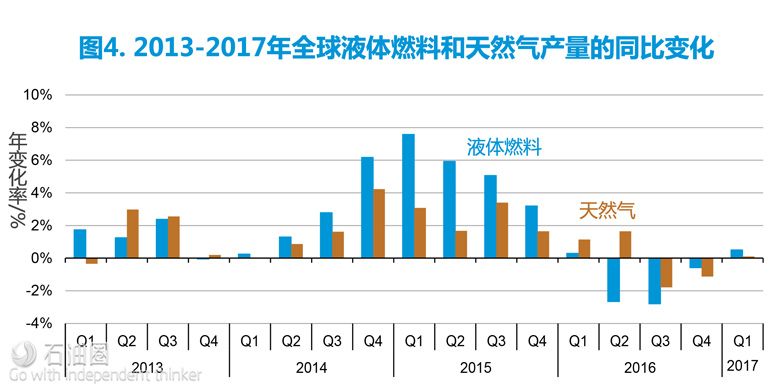
由图4可知,2017年第一季度,全球液体燃料产量增加0.5%,天然气产量基本与2016年第一季度持平。
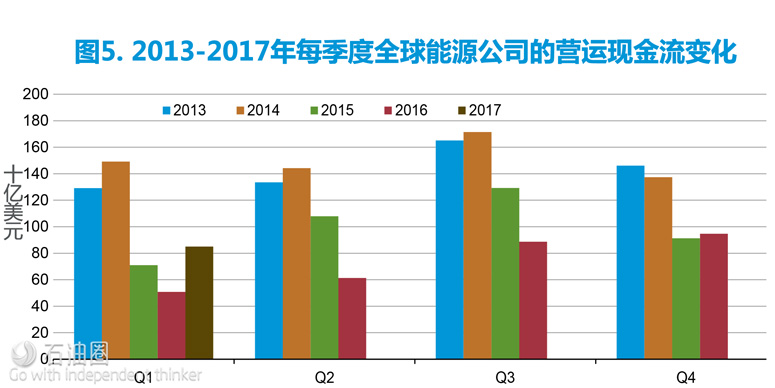
由图5所示,与2016年第一季度相比,2017年第一季度全球能源公司的营运现金流增加了68%,达850亿美元。
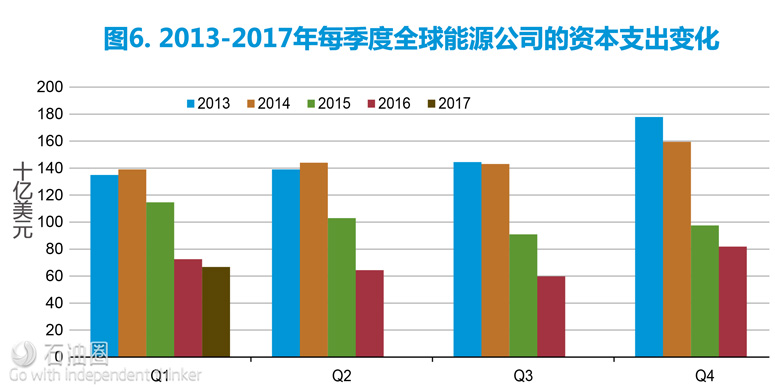
由图6所示,2017年第一季度的资本支出总额为670亿美元,比2016年第一季度低8%。
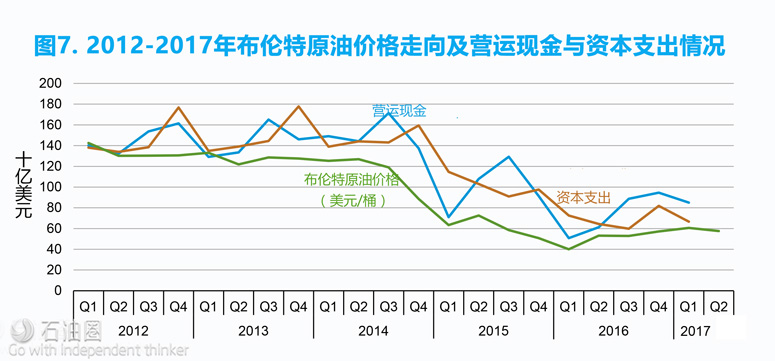
图7是2012-2017年布伦特油价走向及营运现金与资本支出变化曲线。如图所示,油价目前仍在60美元/桶左右徘徊;2017年第一季度营运现金连续第3个季度高于800亿美元,并均高于同期资本支出。
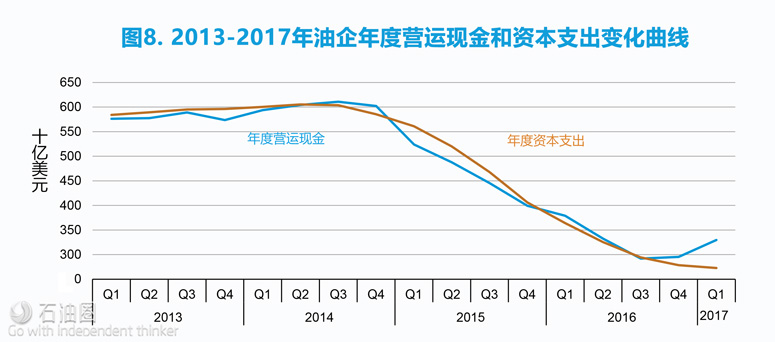
如图8所示,2015年之前,油企的营运现金和资本支出基本持平,约在5500亿-6100亿之间。2015年初开始,营运现金和资本支出同步下滑,这主要是由于整个行业下行,油企都在减少支出、降本增效,以维持运转。但从2016年第三季度开始,营运现金开始逐渐上升,至2017年第一季度末,营运现金比资本支出高出570亿美元。
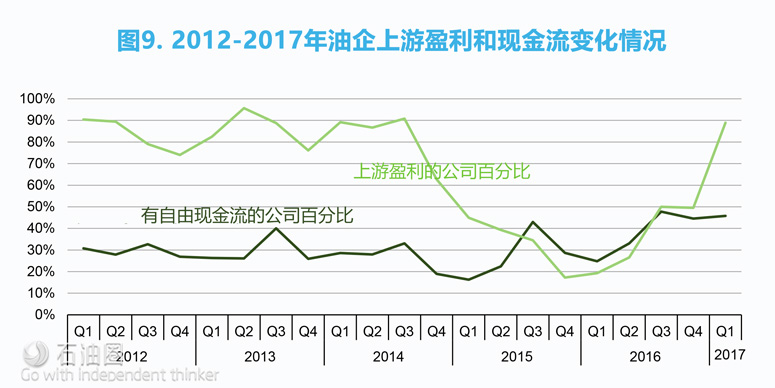
图9展示了2012年至今,能源公司上游盈利情况和现金流情况变化表。这两条线明显地反映了近5年油气行业的大起大落。到2017年第一季度末,几乎一半的公司拥有自由现金流;近九成公司表示,2017年第一季度上游收益明显回升。
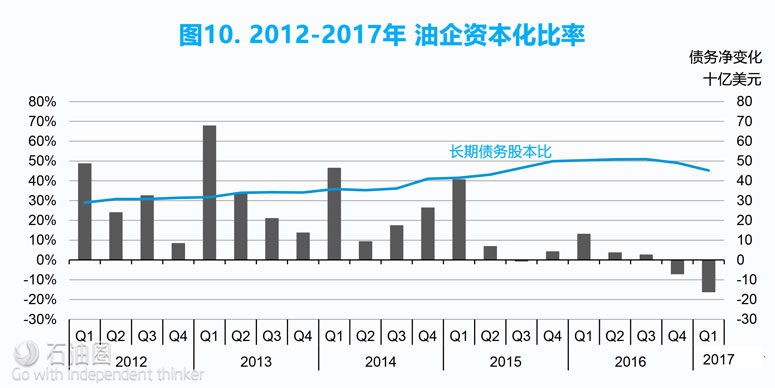
资本化比率又称“长期负债股东权益比率”,是从总体上判断企业债务状况的一个指标,它是长期负债与资产总额的比率。与流动负债相比,长期负债比较稳定,要在将来几个会计年度之后才偿还,所以公司不会面临很大的流动性不足风险,短期内偿债压力不大。
如图10所示,从油价下跌年开始,油企的资本化比率突破40%,并在2016年第三季度达到50%以上。但该指数已在2017年第一季度有所下降,并有望降至40%。
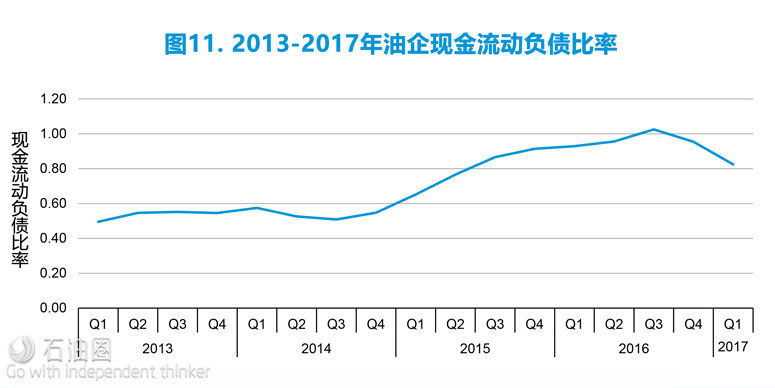
图11展示了2013年至今,油气业的现金流动负债比率。现金流动负债比率是企业一定时期的经营现金流量同流动负债的比率,它可以从现金流量角度来反映企业当期偿付短期负债的能力。现金流动负债比率=年经营现金净流量/年末流动负债×100%,该指标越大,表明企业经营活动产生的现金净流量越多,越能保障企业按期偿还到期债务。2013年以来,油企的现金流动负债比率成上升趋势,这表示油企现金流增加,偿债能力和水平都大幅提高。
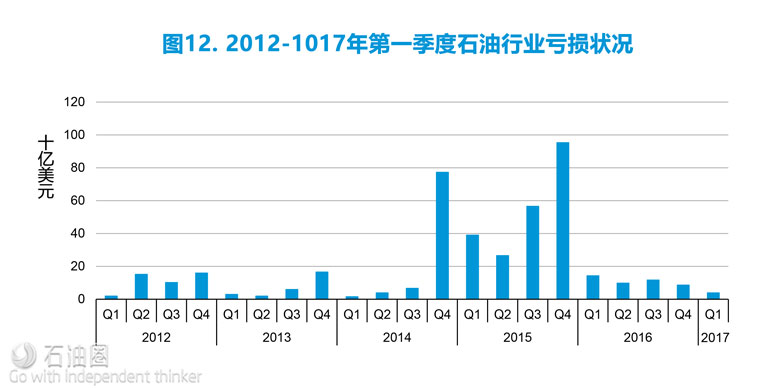
从图12中可以看出,由于油价断崖式下跌,2014年和2015年是油气业亏损最严重的年份。但近期行业复苏势头明显,今年第一季度亏损降到了60亿美元左右,达到了2014年第二季度以来的最低值。
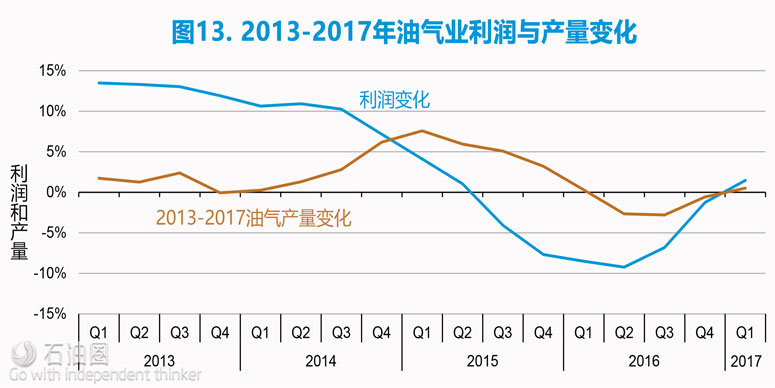
2016年第二季度开始,油价进入稳定期,油气利润率也开始趋稳并缓慢回升。利润率回升也在继续支持油气产量的增加,由图13可知, 2017年第一季度油气产量同比显著回升。
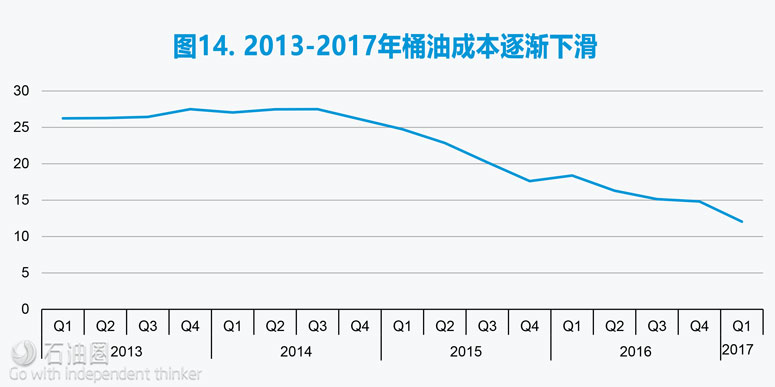
由图14可知,2013-2014年间,桶油成本有些许上涨,但自2014年第三季度开始,桶油成本便开始一路下降,2017年第一季度达到新低。专家预测,2017年桶油成本仍有5%~10%的下降空间,非常规油气生产和深水油气项目成本将是成本下降的主要领域。
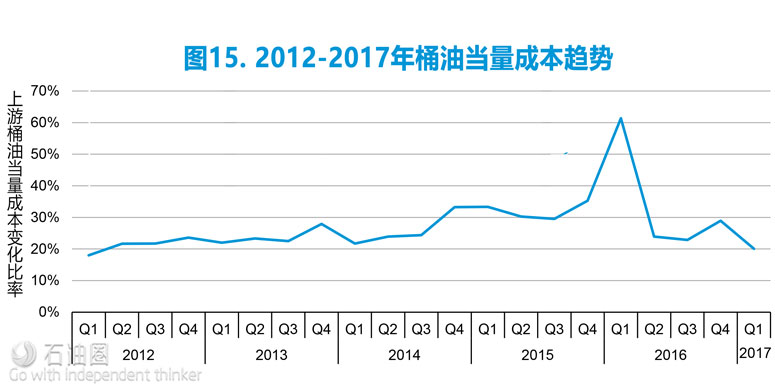
2017年第一季度桶油当量资本支出是季度平均油价的20%,达到了2012年以来的最低水平。如图15所示,2016年第一季度,壳牌以520亿美元收购BG,交易额几乎占上游所有油企交易总额的一半。这也导致了该季度桶油当量成本(桶油当量资本支出)大幅飙升。
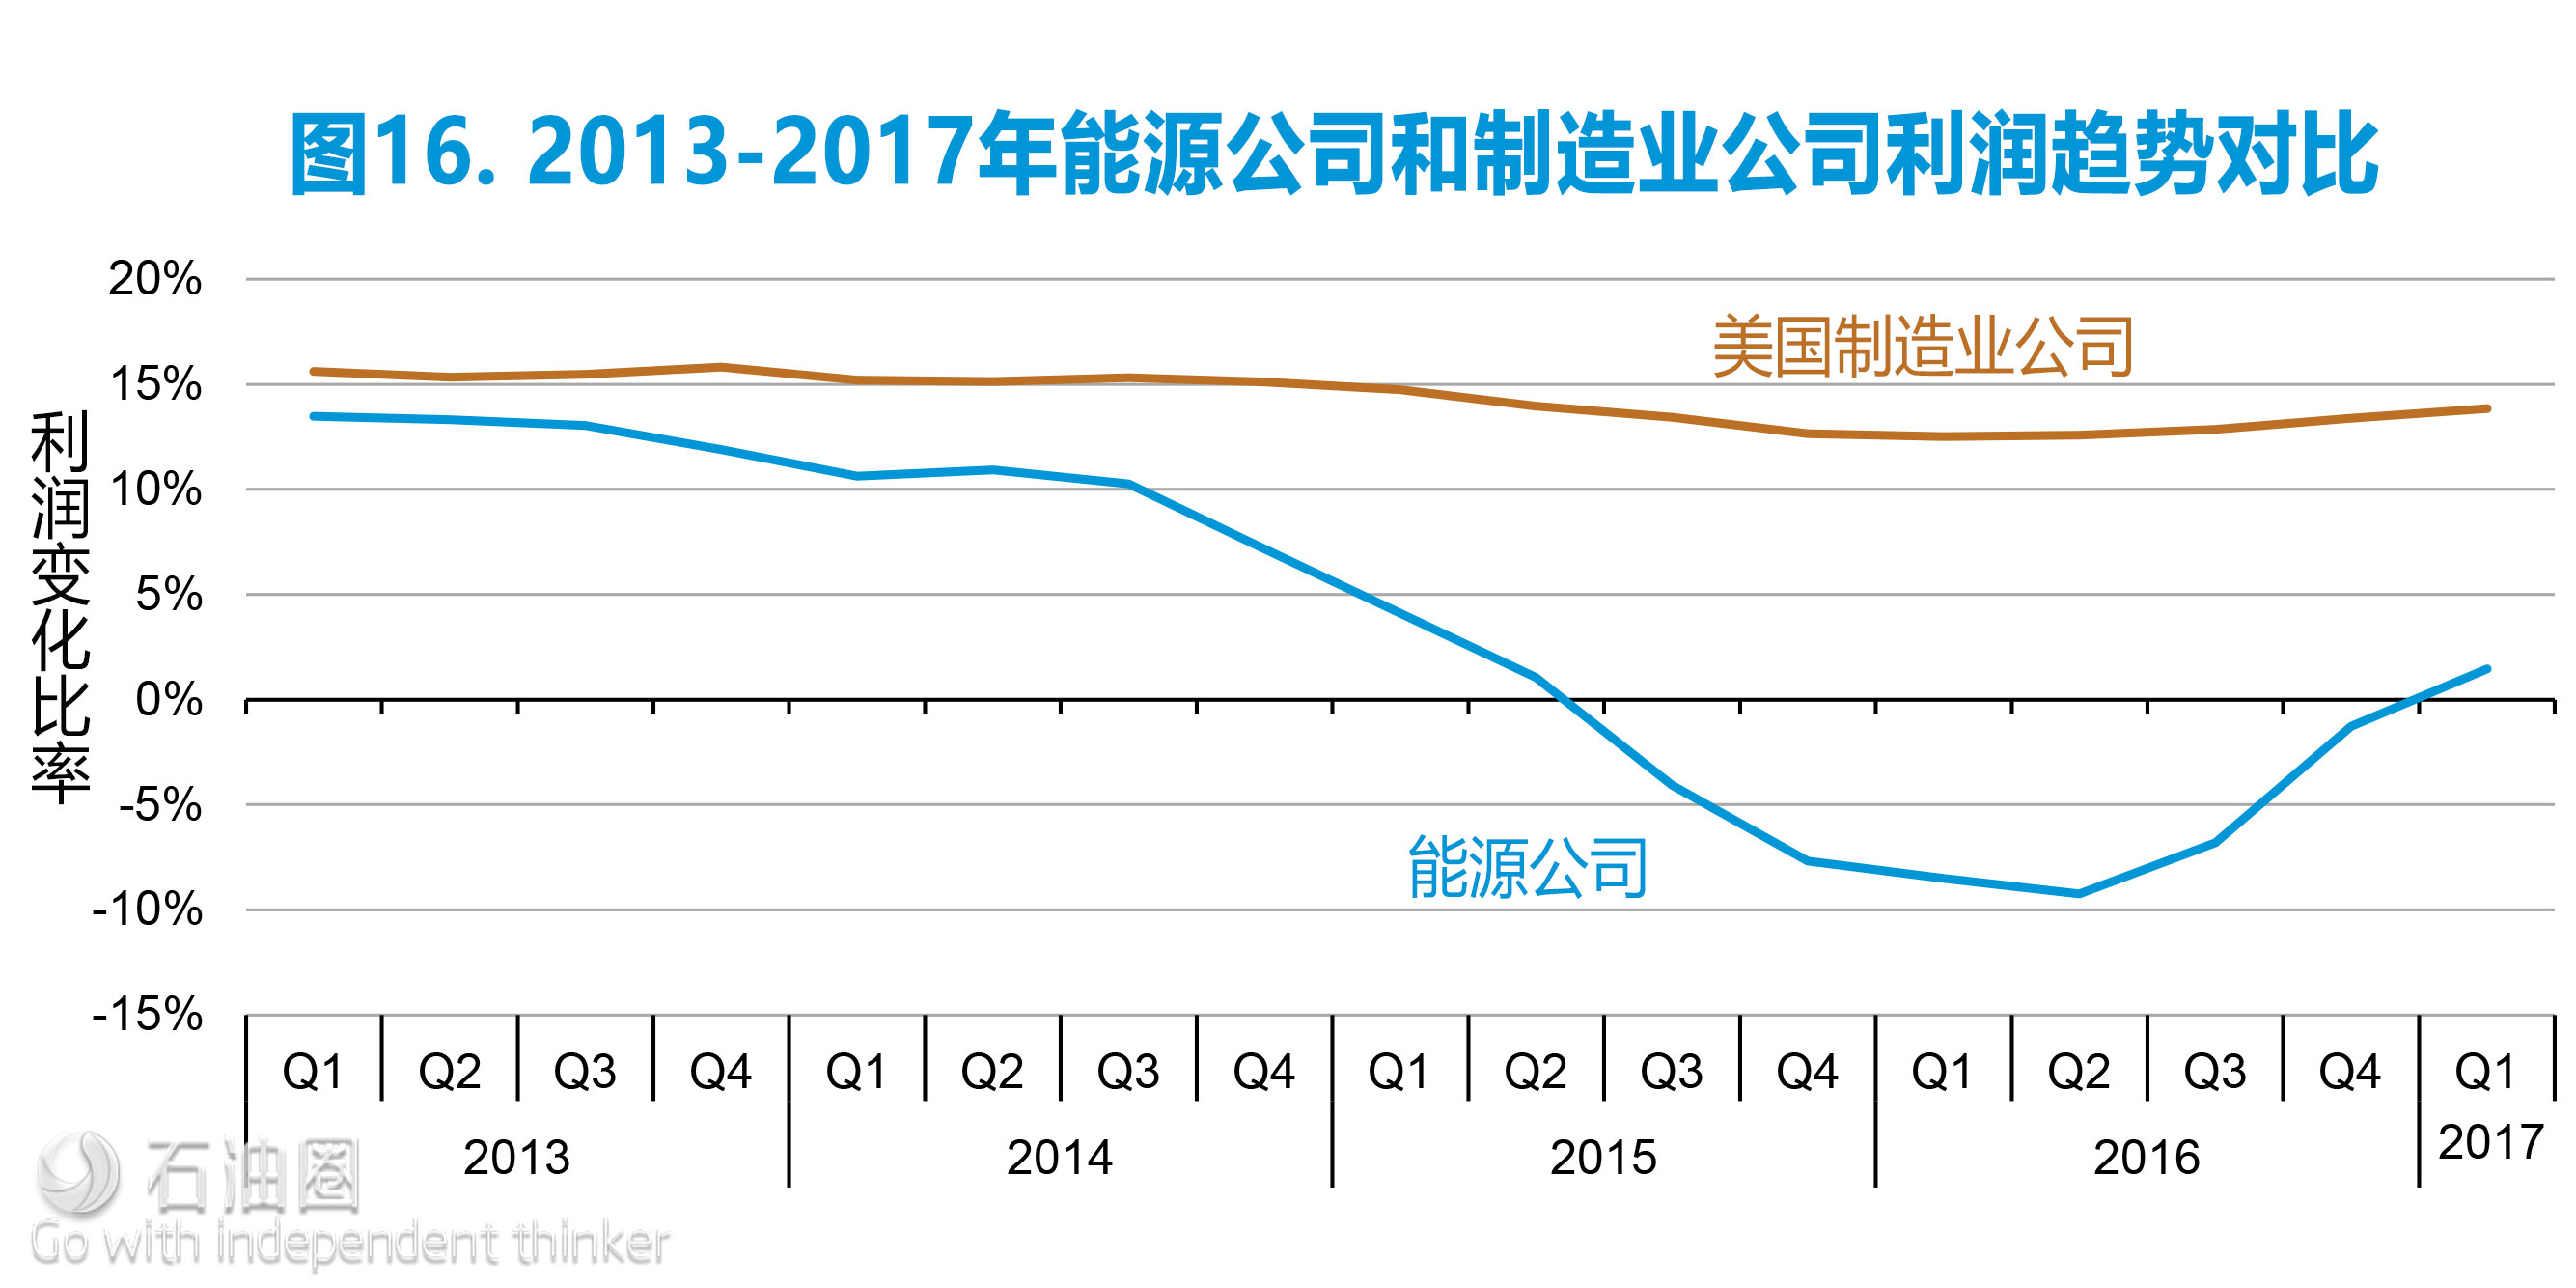
自2015年第二季度以来,全球油企财政状况均不乐观,利润率一直处于负增长状态。但从2017年第一季度开始,油企实现盈亏平衡,正式回归正轨。虽然复苏势头明显,但与平稳发展的制造业相比,盈利幅度仍有一定差距。
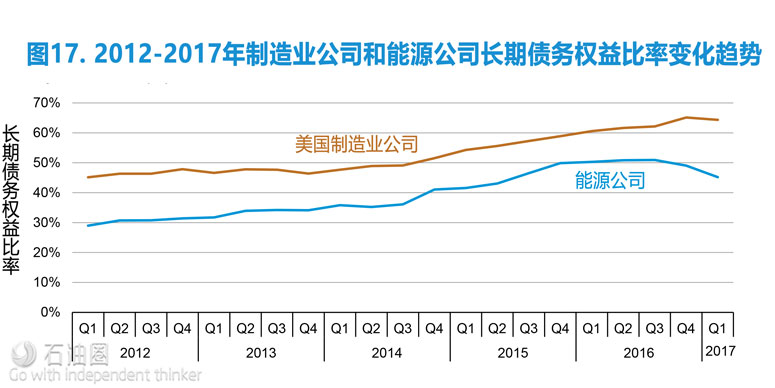
由图17所示,2017年第一季度,油企长期债务权益比率同比下降5%,美国制造业公司同类目比率上涨3%。2017年第一季度,油企长期债务水平降至790亿美元,低于2016年第一季度。
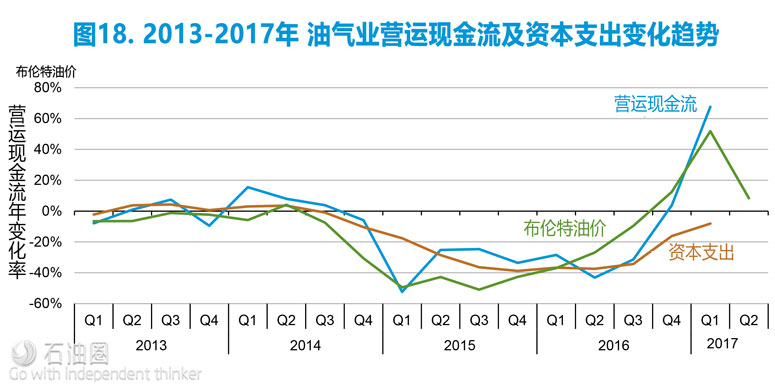
如图18所示,以布伦特油价为基准,2017年第一季度,随着油价攀升,油企营运现金流继续大幅增加,但资本支出明显下降。
综上所述,虽然当前布伦特油价仍不及2012-2014年水平,但已较2016年第一季度显著回升,这也增加了大多数产油商的营运现金流,降低了长期债权比例。虽经历大变,但目前油气复苏势头明显,长期发展前景乐观。
Brent crude oil prices remained lower than in the 2012–14 period but significantly higher than in first-quarter 2016, which increased operating cash flow for most producers
Liquids production increased in first-quarter 2017after three consecutive quarters of declines Energy companies’ long-term debt levels were $79 billion lower than in first- quarter 2016
Capital expenditure continued to decline despite higher oil and natural gas prices, totaling $67 billion in the first quarter of 2017
number of companies
Distribution of global energy companies by production of petroleum liquids, first-quarter 2017 number of companies
Production from the global oil and natural gas companies liquids and natural gas production million barrels of oil equivalent per day
Global liquids production increased 0.5% and natural gas production was unchanged in first-quarter 2017 from first-quarter 2016 levels liquids and natural gas production year-over-year change
Operating cash flow for energy companies increased 68% from first- quarter 2016 to $85 billion in first-quarter 2017 cash from operations billion 2017$ Capital expenditure in first-quarter 2017 totaled $67 billion, 8% lower than first-quarter 2016 capital expenditure billion 2017$ Cash from operations in first-quarter 2017 remained above $80 billion for the third consecutive quarter cash flow items and Brent price billion 2017$; Brent in 2017 $/b Cash from operations was $57 billion higher than capital expenditures for the four quarters ending March 31, 2017 annualized cash flow items billion 2017$
Almost half of companies had a positive free cash flow and almost 90% reported positive upstream earnings in first-quarter 2017 The long-term debt-to-equity ratio declined in recent quarters ascompanies paid off debt
The increase in cash flow has reduced the ratio of debt repayments to cash flow Impairments were the lowest since second-quarter 2014 impairments
Upstream capital expenditure on a per-barrel basis continued to decline upstream capital expenditure per barrel of oil produced Upstream capital expenditures per barrel of oil equivalent were 20% of the quarterly average crude oil price, the second lowest since 2012
Increasing profits contributed to an increase in production
Royal Dutch Shell merged with BG Group in first-quarter 2016. Mergers are typically large, non-recurring expenditures. The $52 billion merger accounted for almost half of all combined company upstream capital 60% expenditure, which contributed to the large increase in the ratio of upstream capital expenditure/boe to Brent price from fourth-quarter 2015 50% to first-quarter 2016.
未经允许,不得转载本站任何文章:
-

- 阿佳徐
-
石油圈认证作者
- 毕业于黑龙江大学英语口译专业,具有丰富的翻译工作经验。致力于观察国际油气行业动态,能够快速、准确传递油气行业最新资讯,提供丰富的油气信息,把握行业动向,为国内企业提供专业的资讯服务。(QQ:348418756)


 石油圈
石油圈


